


- PEPE fell from its $0.00000155 high while BONK dropped from $0.000030.
- PEPE’s descending channel indicated another possible drawdown.
- BONK may either breakdown or breakout depending on buyers’ presence.
Leading memecoins Pepe (PEPE) and Solana-based Bonk (BONK) have had a rough couple of weeks. Using data obtained from CoinMarketCap, Coin Edition found that PEPE was down about 80% from its December high of $0.00000155.
It was a similar situation for BONK, which reached $0.000030 on December 15. But as of this writing, Solana’s leading meme had plunged to just $0.000010.
These declines were in contrast to the performance that brought both memecoins to the limelight. For PEPE, its 365-day performance remained a 1,813% hike, thanks to its surge in April 2023.
BONK’s 90-day 5,185% increase was proof that the goodwill it enjoyed was more recent than PEPE. Furthermore, it is also likely that the price decrease could be linked to intense profit-taking considering the value of gains BONK had given early buyers.
PEPE Price Analysis
From the 4-hour chart, PEPE has failed to find a pattern that triggers a breakout. Although there have been recovery attempts, the price action remained in a descending channel.
Like the descending trendlines, the RSI also showed that PEPE was at risk of another fall. However, if buyers can sustain the support at $0.0000010, then the price might recover and head toward $0.0000011.
However, the possibility of an uptrend was negated by the Directional Movement Index (DMI). At press time, the +DMI (green) was 12.07. The -DMI (red) was 33.85.
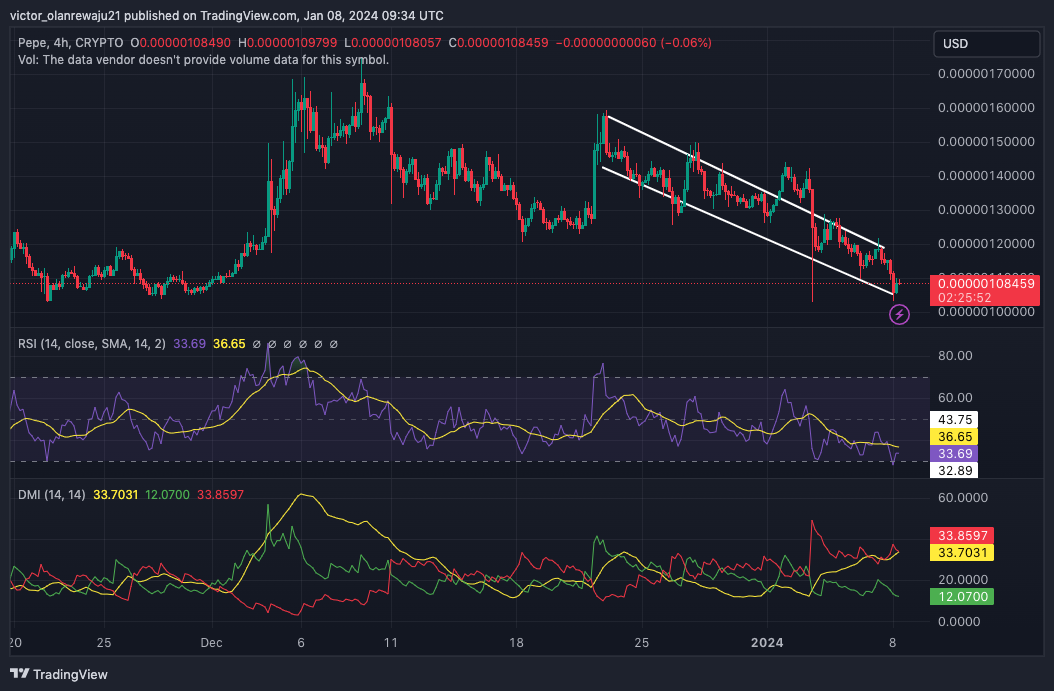
In addition, the ADX (yellow) was 33.70, giving more strength to the -DMI. If this remains the case, then PEPE might consolidate around $0.0000010. If selling pressure increases, it could fall below the zone.
BONK Forms Symmetrical Triangle
BONK has lost 26.75% of its value in the seven days. From the daily chart, the meme had found itself in the middle of a pattern that is unlikely to result in any significant move.
Another issue with BONK was the declining volume. During BONK’s uptrend, its trading volume soared. However, the volume in recent days has been declining, suggesting that buyers were absent.
Also, BONK had formed a symmetrical triangle on the daily chart. The pattern indicates BONK had consolidated for a while and could be forced to breakout or breakdown.
If the BONK price breaks below the trendline at $0.00010, it could start a new bearish trend. But a breakout above $0.000011 would require the presence of buyers. If this happens, it could be the start of a new bullish trend.
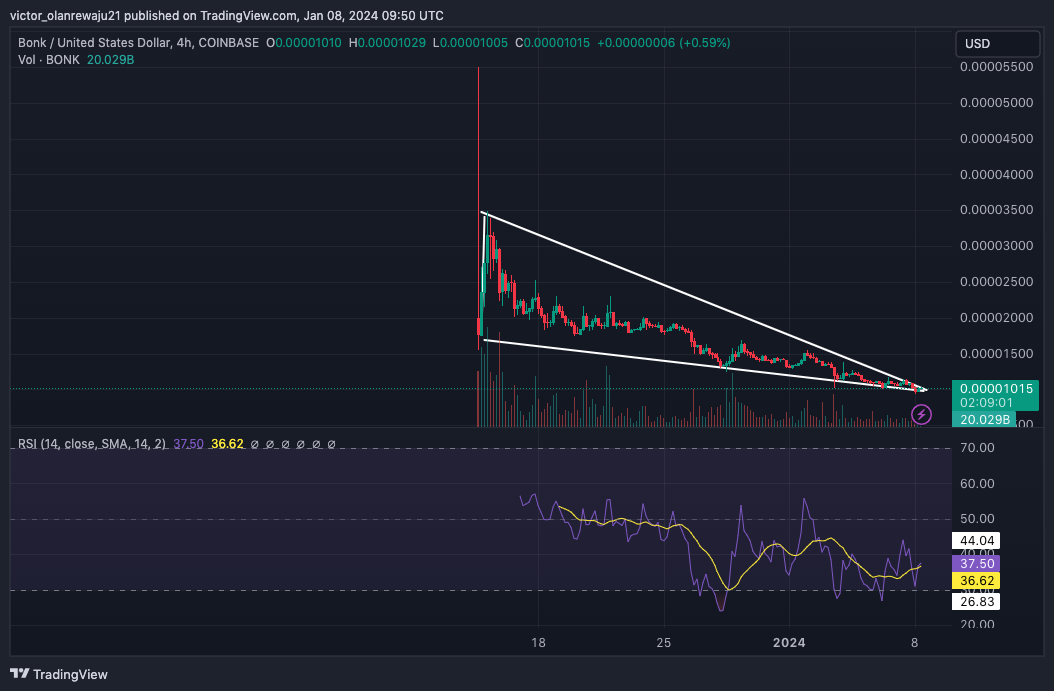
In the meantime, the RSI had risen slightly to 37.50, indicating a possible return of buyers. However, the RSI would need more than the recent increase to confirm a potential increase in BONK’s price.
Disclaimer: The information presented in this article is for informational and educational purposes only. The article does not constitute financial advice or advice of any kind. Coin Edition is not responsible for any losses incurred as a result of the utilization of content, products, or services mentioned. Readers are advised to exercise caution before taking any action related to the company.


 Price Prediction 2026, 2027, 2028, 2029, 2030-2050")
