


- Profit-taking led PEPE’s price to breach the $0.0000013 support.
- A slide below $0.0000012 is likely before the possible rise in value.
- PEPE may retest $0.0000014 if the token becomes oversold and buying pressure increases.
According to CoinMarketCap, the price of Pepe (PEPE) has decreased by 13.12% in the last seven days, while the memecoin trades at $0.0000012. This performance means that PEPE was the worst-performing cryptocurrency out of the top meme coins within the said period.
PEPE’s fall was a result of selling pressure that started on December 16. As of then, the crypto price was $0.0000014. But between December 1 and 16, PEPE had gained about 40%, indicating that holders had made profits from the token.
As expected, profit-taking started and bears were able to breach the $0.0000013 support. Also, the price decline meant that bulls’ attempt at triggering an upward momentum had been quenched. This was evident in the Relative Strength Index (RSI).
Weakness May Soon Change to Strength
At press time, the RSI was 42.38, indicating that PEPE’s northward strength had become weak. However, there is a chance the bearish state of the token could change soon. But that will only be the case if the RSI reading falls below 40.00.
If the RSI drops below 40.00, it would mean that PEPE is approaching an oversold point. So, if buying pressure appears at this level, the direction may reverse to the upside. Should this happen, PEPE may retest the $0.0000013 support.
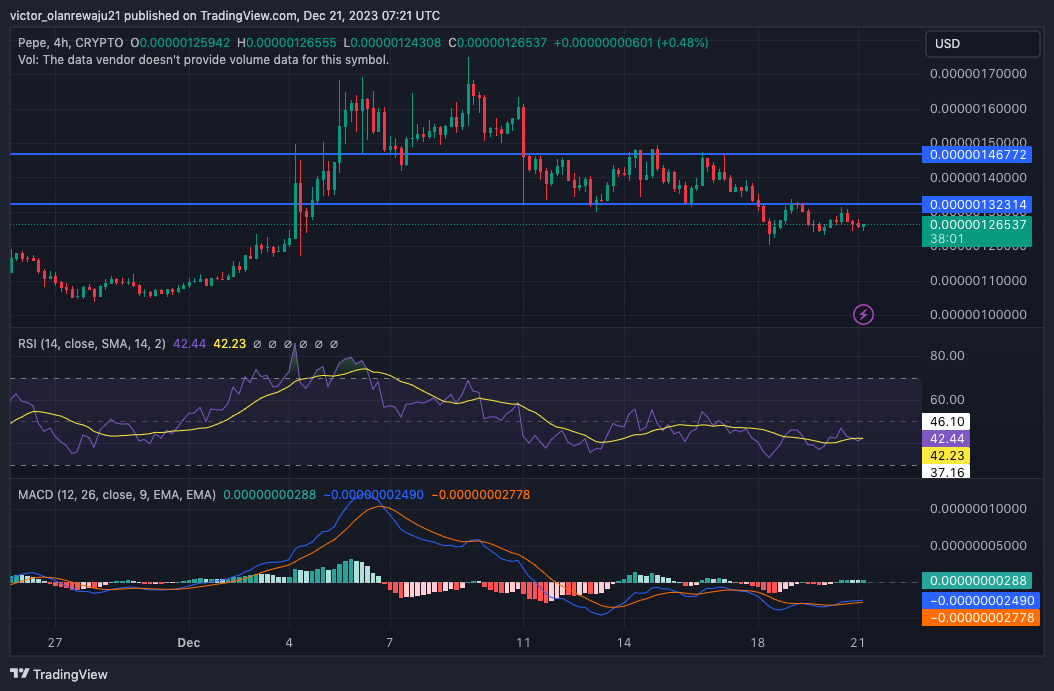
PEPE/USD 4-Hour Chart (Source: TradingView)
However, the RSI is not the only indicator that is crucial to PEPE’s price action. From the 4-hour PEPE/USD chart, the 12 (blue) and 26 (orange) EMAs were negative. As shown by the Moving Average Convergence Divergence (MACD), the long and short-term EMAs need to flip positive to confirm a bullish thesis.
PEPE to Remain In Consolidation
Another indicator to consider when looking at PEPE is the Awesome Oscillator (AO). At press time, the AO was in the negative region. The negative reading of the AO implies that the 5-day Moving Average (MA) was greater than the 34-day MA.
The AO reading is also a sign of a downtrend, meaning PEPE may slide below $0.0000012. But as mentioned earlier, an increase in accumulation could quickly change the look of things.
Furthermore, Coin Edition evaluated the Bollinger Bands (BB). At press time, the bands had contracted, indicating that a notable price fluctuation may not occur. So, PEPE’s high may not surpass $0.0000014 while its low may still be in the $0.0000010 region in the short term.
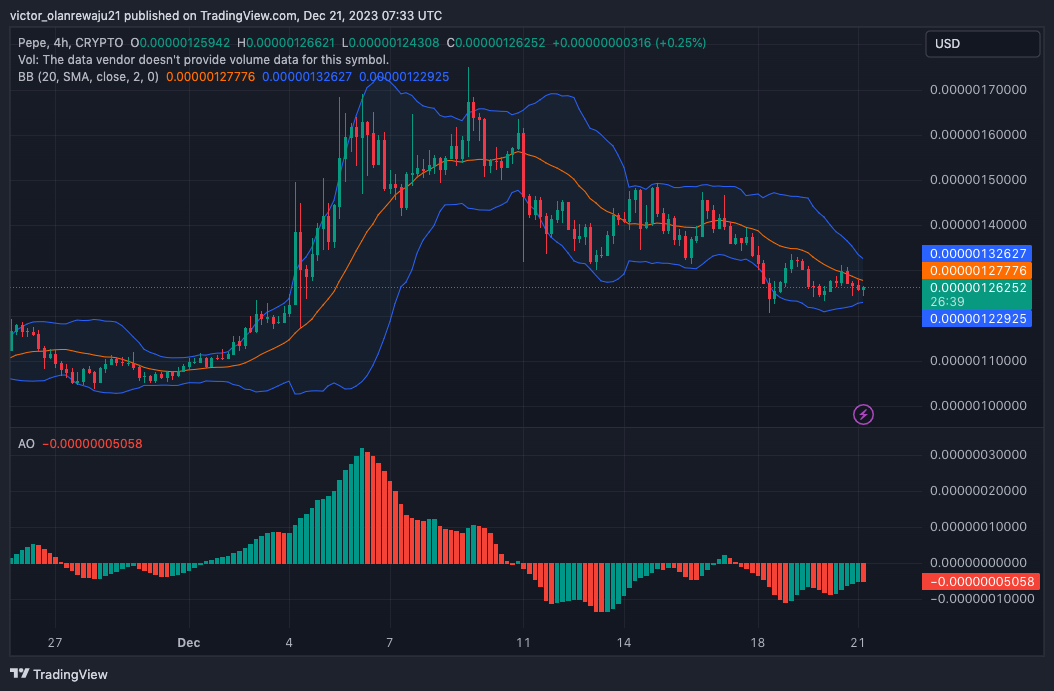
PEPE/USD 4-Hour Chart (Source: TradingView)
Additionally, the lower band of the BB was close to touching PEPE at $0.0000012. Should this happen, then PEPE would be considered oversold. This could also lead to a turnaround from the downward direction to the upside.
Disclaimer: The information presented in this article is for informational and educational purposes only. The article does not constitute financial advice or advice of any kind. Coin Edition is not responsible for any losses incurred as a result of the utilization of content, products, or services mentioned. Readers are advised to exercise caution before taking any action related to the company.


 Price Prediction 2026, 2027, 2028, 2029, 2030-2050")