


- PEPE token’s bullish trend persists despite potential bearish signals.
- The symmetrical triangle pattern hints at an impending price breakout.
- Technical indicators support a prevailing bearish sentiment.
The Pepe token has experienced a notable uptrend over the past week, showing strong bullish momentum. Throughout this period, the token’s price has fluctuated between a high of $0.0000081 and a low of $0.00000675. The positive trend is clearly evident on the daily chart, where PEPE has gained 4.28% in the last 24 hours. As of press time, the token is trading at $0.00000719.
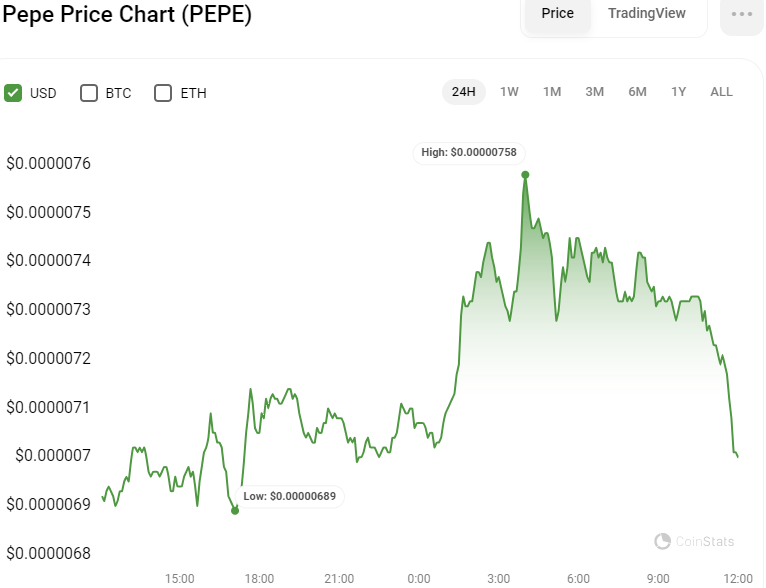
PEPE/USD 24-Hour Chart (Source: CoinStats)
This upward movement in price is also reflected in the token’s market capitalization, which has increased by 0.52% today, reaching $2,924,629,974. This boost has positioned the PEPE token as the 35th largest by market cap.
Moreover, there has been a significant increase in trading volume, up 27.21% in the past day, totaling $752,162,557. This surge indicates a robust investor interest and a generally positive sentiment, suggesting potential for further price gains in the short term.
PEPE Exhibits a Symmetrical Triangle
The PEPE token is navigating a symmetrical triangle pattern on the 4-hour chart, highlighting a phase of consolidation and uncertainty among traders. This technical formation typically signals a potential breakout as the price oscillates within a progressively narrowing range bounded by converging support and resistance levels. Investors and traders are keenly watching for a definitive break either above or below this pattern to gauge the token’s future trajectory.
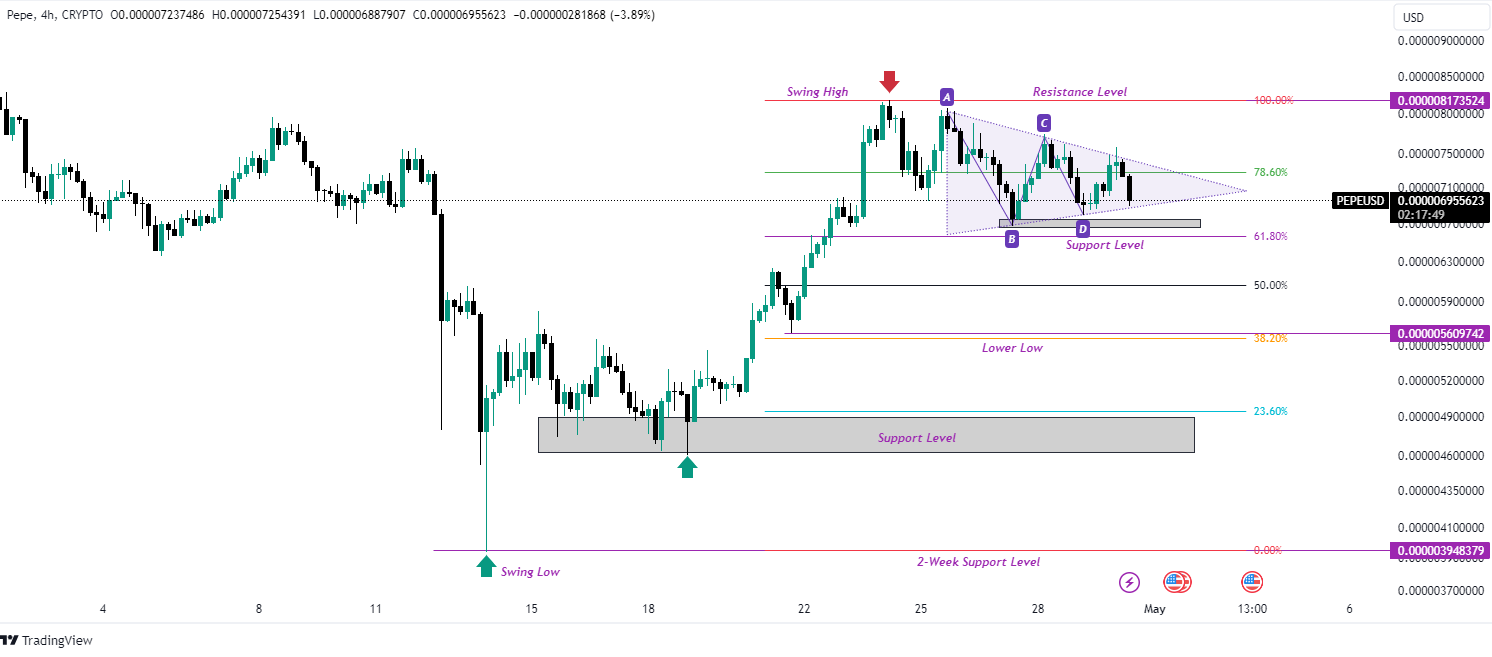
PEPE/USD 4-Hour Chart (Source: Tradingview)
As of press time, the market sentiment for the PEPE token leans towards bearishness. The prevailing trend suggests a potential breakout to the downside, where the token might retest its immediate support level at $0.00000674.
Should this level fail to hold, the token is likely to experience further declines, targeting the lower support zones and potentially reaching a 12-day low. This scenario aims to clear out market liquidity present at these lower levels, accentuating the bearish outlook.
Conversely, if the PEPE token manages an upward breakout, it is expected to confront the resistance at $0.00000817. A successful breach of this barrier could pave the way for further gains, challenging higher resistance levels and signaling a shift in market dynamics.
Bearish Signals Prevail
From a technical analysis standpoint, the Moving Average Convergence Divergence (MACD) indicator substantiates the bearish sentiment dominating the PEPE market. As of this publication, the MACD line is trending downwards, having crossed below the zero threshold at 0.000000015386.
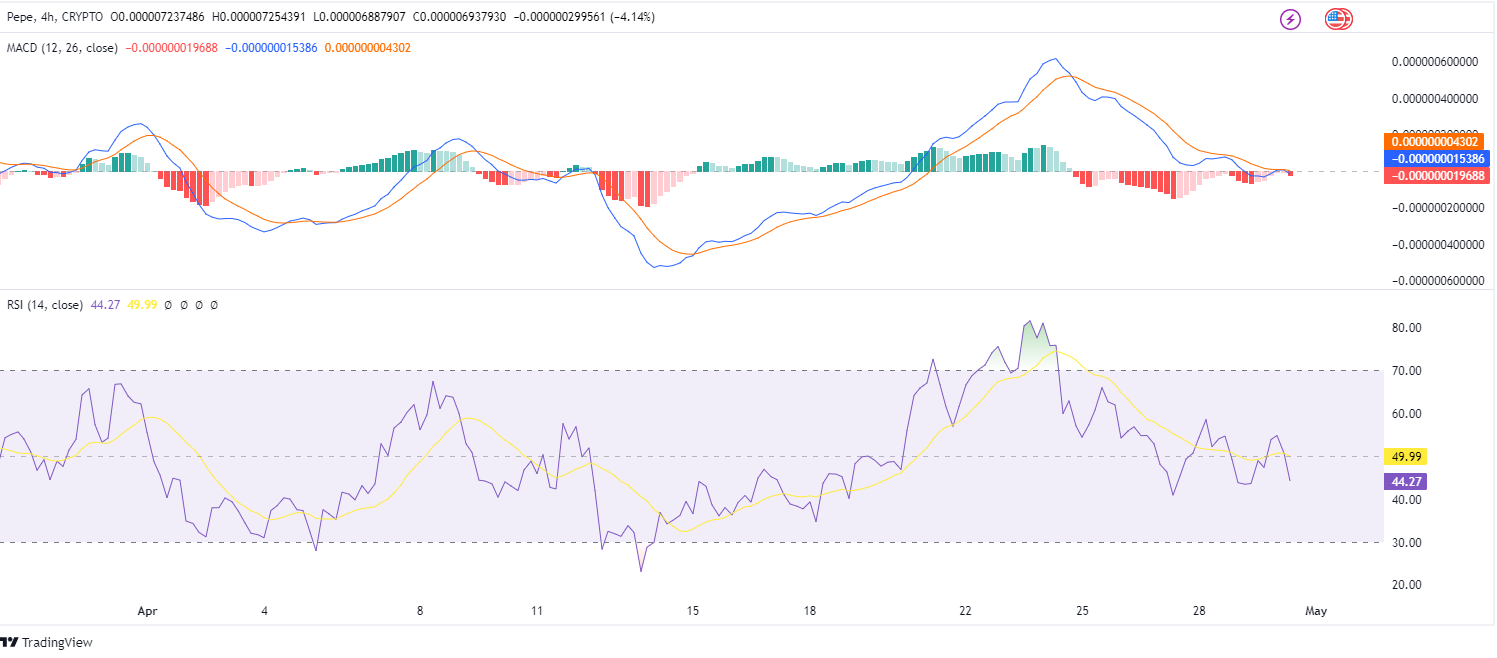
PEPE/USD 4-Hour Chart (Source: Tradingview)
This movement not only reflects growing bearish momentum but also suggests an increase in selling pressure, with the MACD line trading below the signal line and the histogram expanding in the red zone.
Additionally, the Relative Strength Index (RSI) is recorded at 44.27, moving toward a lower spectrum and further indicating bearish momentum. Trading below the neutral 50 mark, the RSI underscores the potential for further price declines in the near term, as it suggests that the market could still accommodate additional downward movements.
Disclaimer: The information presented in this article is for informational and educational purposes only. The article does not constitute financial advice or advice of any kind. Coin Edition is not responsible for any losses incurred as a result of the utilization of content, products, or services mentioned. Readers are advised to exercise caution before taking any action related to the company.
 Price Prediction 2026-2030: Will TRX Hit $0.50 Soon?")
 Price Prediction 2026-2050: Will HYPE Hit $100 Soon?")


: What Happens If You Use an Unlicensed Platform?")