Disclaimer: The information presented in this article is for informational and educational purposes only. The article does not constitute financial advice or advice of any kind. Coin Edition is not responsible for any losses incurred as a result of the utilization of content, products, or services mentioned. Readers are advised to exercise caution before taking any action related to the company.
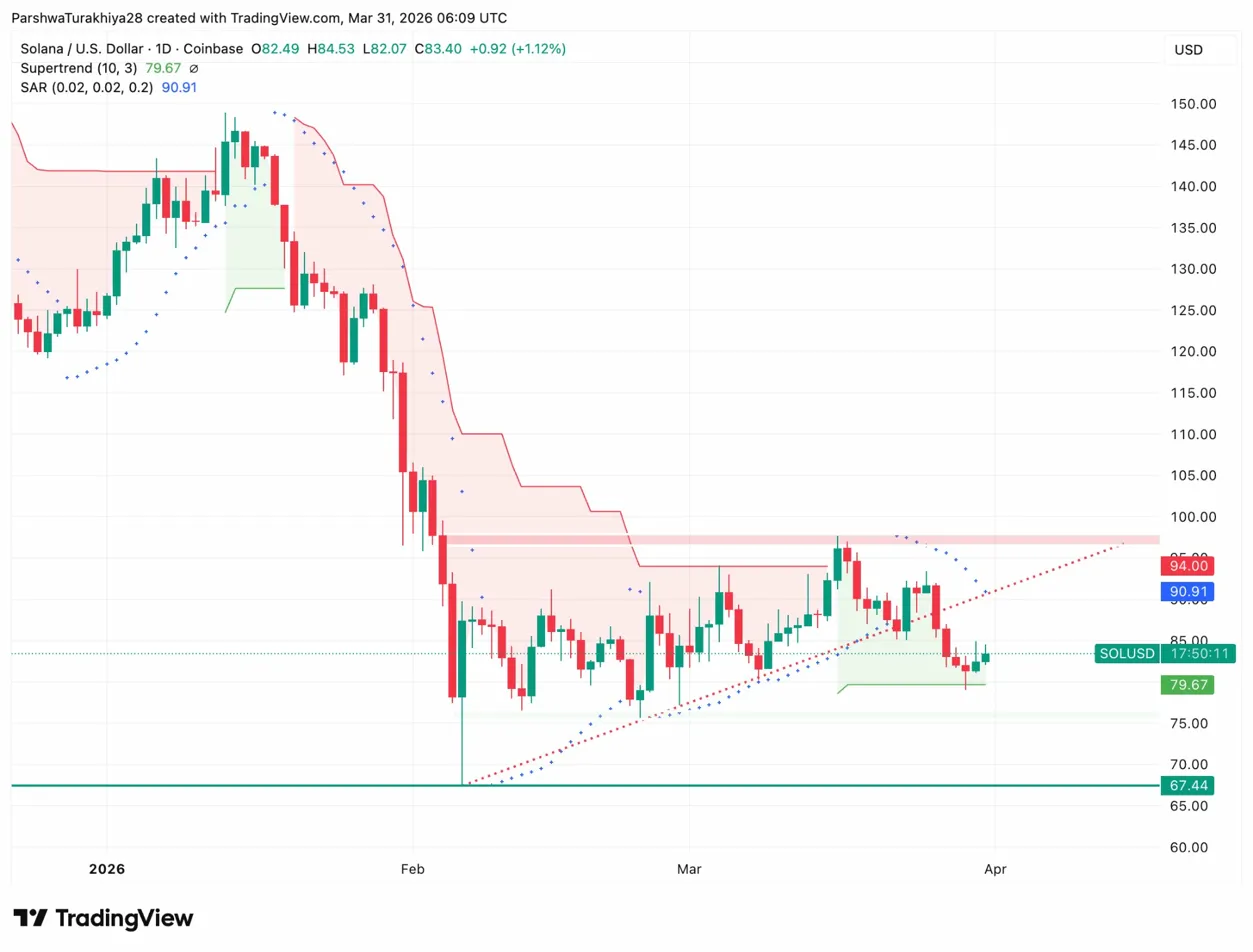
SOL diperdagangkan pada $83,40, naik 1,12%, dengan Supertrend di $79,67 sebagai support terakhir sebelum level terendah Februari di $67,44.
ETF spot SOL AS mencatat arus keluar $6,17 juta pada 30 Maret, mendorong arus masuk kumulatif kembali ke $979,37 juta karena total aset bersih turun menjadi $801,91 juta.
Grafik dua mingguan menempatkan SOL di level Fibonacci 0.618 di $52.11 hingga $72.55, zona yang sama yang mendahului reli ke $295 pada tahun 2025.
SOL diperdagangkan pada $83,40 pada 31 Maret, turun 77% dari level tertinggi sepanjang masa, karena ETF spot AS berdarah untuk hari ketiga berturut-turut dan zona Fibonacci 0,618 dua mingguan yang mendahului reli Solana ke $295 berada tepat di bawah harga saat ini.
Grafik Harian SOL: Supertrend Bertahan Saat SAR Membatasi Pemulihan
SOL mencapai titik terendah di $ 67,44 pada bulan Februari dan telah membangun posisi terendah yang lebih tinggi sejak itu. Garis tren putus-putus naik dari level terendah itu naik ke arah harga saat ini di dekat $83, dan Supertrend di $79,67 telah berada di bawah harga sejak pertengahan Maret memberikan lantai naik.
SAR di $90,91 berada di atas kepala dan telah bearish sejak Februari, membatasi setiap upaya pemulihan. Harga belum ditutup di atas $94 sejak lonjakan pertengahan Maret, dan zona resistensi antara $94 dan $100 telah menolak SOL empat kali.
Struktur harian adalah serangkaian tertinggi yang lebih rendah terhadap titik terendah yang lebih tinggi, kompresi yang biasanya diselesaikan dengan jeda arah. Garis tren naik dan Supertrend bersama-sama menciptakan lantai yang telah bertahan selama enam minggu. Kehilangan $79,67 pada penutupan harian menghapus kedua support secara bersamaan dan menempatkan $67,44 kembali dalam tampilan.
Level Utama untuk SOL (April 2026)
Tingkat
Nilai
Peran
Dukungan Supertrend
US$79.67
Lantai harian yang kritis
Garis tren naik
$82 hingga $84
Dukungan jangka pendek
Ketahanan SAR
US$90.91
Perlawanan pertama
Zona resistensi
$94 hingga $100
Zona overhead utama
Terendah Februari
US$67.44
Target penurunan
Dua mingguan 0,618 Fib
$52.11 hingga $72.55
Zona dukungan makro
Arus Keluar ETF SOL: Tiga Hari Berturut-turut Keluar Institusional
ETF spot SOL AS mencatat arus keluar $6,17 juta pada 30 Maret, seluruhnya dari BSOL Bitwise yang melihat $6,17 juta pergi dalam satu sesi. Sehari sebelumnya melihat keluar $7,84 juta, dan 26 Maret mencatat arus keluar $1,04 juta.
Tiga hari negatif berturut-turut telah menarik arus masuk bersih kumulatif kembali ke $ 979,37 juta, menggerakkan tonggak sejarah $ 1 miliar lebih jauh setelah terlihat dekat dua minggu lalu. Total aset bersih telah turun menjadi $801,91 juta dari level tertinggi $936,95 juta pada 17 Maret.
Tren arus keluar sepanjang paruh kedua Maret konsisten dan dipercepat. 16 Maret adalah hari arus masuk terakhir yang berarti di $17,81 juta, dan data ETF telah datar atau negatif setiap hari sejak itu.
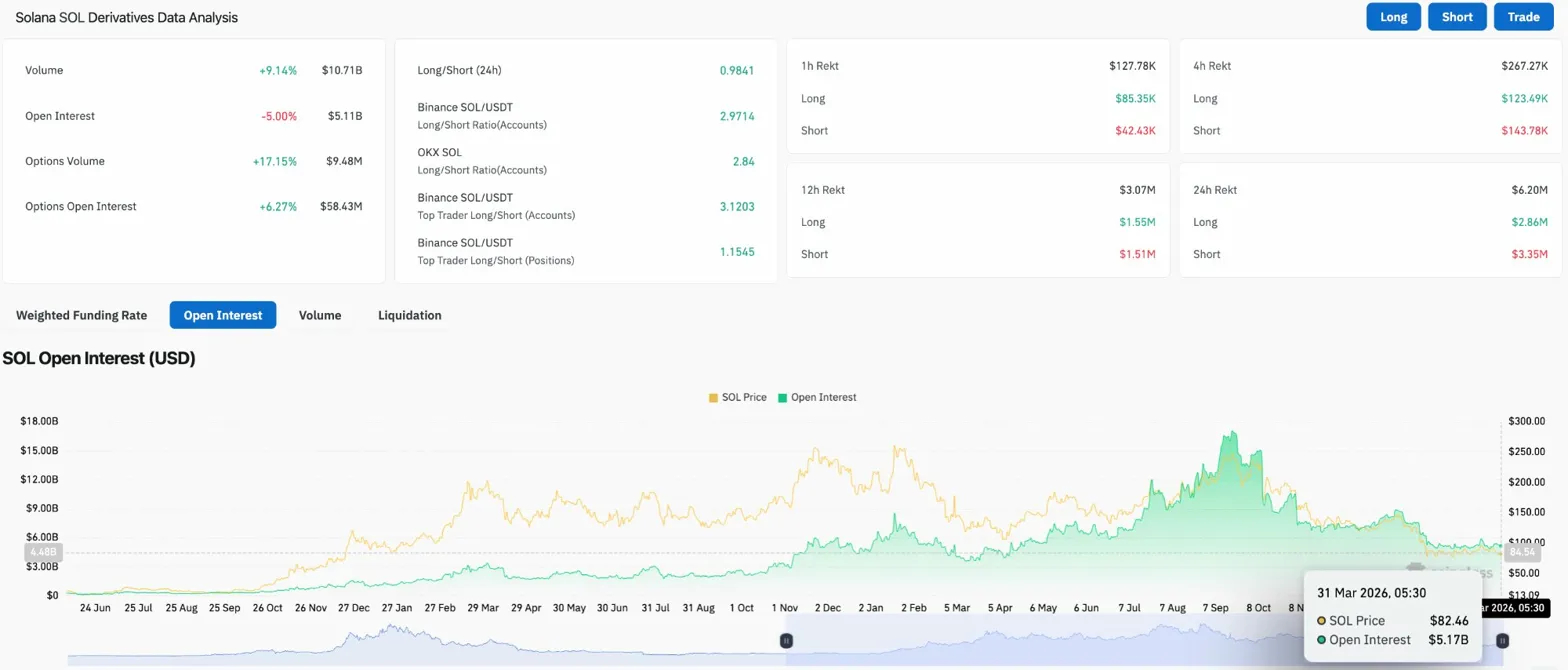
Volume berjangka naik 9,14% menjadi $10,71 miliar sementara OI turun 5% menjadi $5,11 miliar. Volume naik dan OI turun adalah kombinasi spesifik yang menunjuk ke penutupan posisi daripada entri baru. Pedagang mengambil keuntungan atau memotong kerugian daripada menambahkan taruhan terarah baru. Volume opsi naik 17,15% menjadi $9,48 juta dan opsi OI naik 6,27% menjadi $58,43 juta, menunjukkan beberapa pedagang beralih dari posisi berjangka langsung ke posisi opsi lindung nilai menjelang April.
Rasio long/short Binance berada di 2.9714, sangat condong ke arah posisi long. Akun trader teratas condong lebih jauh di 3.1203. Namun data likuidasi 24 jam menunjukkan $2,86 juta dalam harga beli dihapus terhadap $3,35 juta dalam celana pendek, dengan celana pendek benar-benar menyerap lebih banyak rasa sakit sepanjang hari. Likuidasi pendek itu agak konstruktif tetapi tidak mengesampingkan penurunan OI yang lebih luas, yang mencerminkan pengurangan posisi bersih daripada akumulasi.
Kasus Dua Mingguan: Apakah SOL Pada Titik Masuk Generasi?
Where Are All The Solana Maxis Now? 🤔
They Told Their Followers To Buy $SOL Above $250. Screamed "To The Moon" At ATH.
Now Price Is Below $80… And They're Silent. Not A Single Tweet Saying "Buy Now."
Analis CryptoPatel menerbitkan grafik SOL dua mingguan minggu ini yang mencatat bahwa Solana telah turun 77% dari level tertinggi sepanjang masa dan sekarang berada di dekat zona dukungan Fibonacci 0,618 antara $52,11 dan $72,55. Dia mengidentifikasi zona ini sebagai area support dan entry, dengan target di $500 dan $1.000, dan kisaran akumulasi $45 hingga $75.
Grafik dua mingguan menempatkan aksi harga saat ini dalam konteks yang berbeda dari harian. Level Fibonacci 0.618 di $52.11 hingga $72.55 berada di bawah harga saat ini, yang berarti SOL belum mencapai bagian terdalam dari zona support. Jika Supertrend harian di $79,67 menyerah dan terendah Februari di $67,44 menembus, zona support dua mingguan menjadi referensi yang relevan. Level Fibonacci yang sama pada siklus 2022 hingga 2023 menandai lantai sebelum reli ke $295. Apakah itu berulang tergantung pada faktor-faktor yang jauh di luar grafik, tetapi paralel struktural perlu dicatat saat April dimulai.
Prediksi Harga Solana: Apa yang Perlu Disampaikan April
Skenario Kenaikan Untuk Diperhatikan Pada bulan April: Tahan $79,67 setiap hari dan garis tren naik tetap utuh. Klaim kembali SAR di $90,91 pada penutupan harian dan zona resistensi di $94 hingga $100 menjadi ujian April. Arus keluar ETF berbalik positif dan OI pulih di atas $5,5 miliar akan mengkonfirmasi posisi institusional kembali. Penembusan bersih di atas $100 membuka jalan menuju target dua mingguan dalam jangka waktu yang lebih lama.
Skenario Penurunan Yang Harus Diperhatikan Pada April: Kehilangan $79,67 dan kompresi menjadi penurunan. Terendah Februari di $67,44 adalah pemberhentian pertama, dan di bawahnya zona Fibonacci 0,618 dua mingguan antara $52,11 dan $72,55 menjadi support makro. Dengan arus keluar ETF yang semakin cepat dan OI menurun, penembusan di bawah $79,67 tanpa katalis untuk membalikkan gambaran aliran akan bergerak cepat.
Disclaimer: The information presented in this article is for informational and educational purposes only. The article does not constitute financial advice or advice of any kind. Coin Edition is not responsible for any losses incurred as a result of the utilization of content, products, or services mentioned. Readers are advised to exercise caution before taking any action related to the company.
We use cookies on our website to give you the most relevant experience by remembering your preferences and repeat visits. By clicking “Accept All”, you consent to the use of ALL the cookies. However, you may visit "Cookie Settings" to provide a controlled consent.
This website uses cookies to improve your experience while you navigate through the website. Out of these, the cookies that are categorized as necessary are stored on your browser as they are essential for the working of basic functionalities of the website. We also use third-party cookies that help us analyze and understand how you use this website. These cookies will be stored in your browser only with your consent. You also have the option to opt-out of these cookies. But opting out of some of these cookies may affect your browsing experience.
Necessary cookies are absolutely essential for the website to function properly. These cookies ensure basic functionalities and security features of the website, anonymously.
Cookie
Duration
Description
cookielawinfo-checkbox-analytics
11 months
This cookie is set by GDPR Cookie Consent plugin. The cookie is used to store the user consent for the cookies in the category "Analytics".
cookielawinfo-checkbox-functional
11 months
The cookie is set by GDPR cookie consent to record the user consent for the cookies in the category "Functional".
cookielawinfo-checkbox-necessary
11 months
This cookie is set by GDPR Cookie Consent plugin. The cookies is used to store the user consent for the cookies in the category "Necessary".
cookielawinfo-checkbox-others
11 months
This cookie is set by GDPR Cookie Consent plugin. The cookie is used to store the user consent for the cookies in the category "Other.
cookielawinfo-checkbox-performance
11 months
This cookie is set by GDPR Cookie Consent plugin. The cookie is used to store the user consent for the cookies in the category "Performance".
viewed_cookie_policy
11 months
The cookie is set by the GDPR Cookie Consent plugin and is used to store whether or not user has consented to the use of cookies. It does not store any personal data.
Functional cookies help to perform certain functionalities like sharing the content of the website on social media platforms, collect feedbacks, and other third-party features.
Performance cookies are used to understand and analyze the key performance indexes of the website which helps in delivering a better user experience for the visitors.
Analytical cookies are used to understand how visitors interact with the website. These cookies help provide information on metrics the number of visitors, bounce rate, traffic source, etc.
Advertisement cookies are used to provide visitors with relevant ads and marketing campaigns. These cookies track visitors across websites and collect information to provide customized ads.