


- SHIB’s burn rate skyrockets 4200%, fueling market optimism and price support.
- Technical analysis reveals SHIB’s bullish breakout potential from a symmetrical triangle.
- Shiba Inu may be on the brink of a 51% rally, eyeing a triumphant return to its 12-month peak.
As per the market analysts, Shiba Inu (SHIB) is about to enter an enormous breakthrough. The latest developments and a technical analysis point out that Shiba Inu might have a 52% rally, which means that the cryptocurrency will likely reach the 12-month high level. Such optimistic prediction is under fluctuating market dynamics, where Shiba Inu has shown the spirit and possibility of strong growth.
Shiba Inu Market Momentum Grows
The current price of SHIB is $0.000009569. Even though Shiba Inu had a slightly negative growth of -2.32% over the previous seven days, it had shown signs of recovery in the past 24 hours, with gains. The revival is supported by the momentum of the whole market, partly influenced by the rise of Bitcoin, which is a positive factor for the entire cryptocurrency scene.
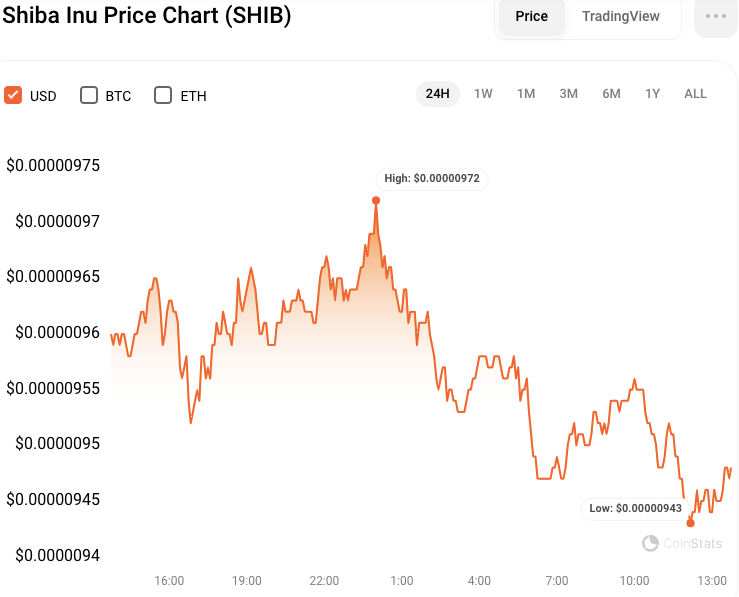
SHIB/USD 24-hour price chart (source: CoinStats)
However, at press time, SHIB was trading at $0.000009528, a 0.98% decline from the intra-day high. Concurrently, SHIB’s market capitalization and 24-hour trading volume fell by 0.64% and 24%, respectively, to $5.62B and $134.71M.
One of the personalities in the Shiba Inu community, the so-called “SHIB KNIGHT,” has drawn attention to the technical patterns indicating an upcoming run-up. The symmetrical triangle on the weekly chart is the main sign of this possible growth.
This formation is usually a sign of the end of the downward movement, which prepares the ground for a bullish breakout. With a successful breach of this pattern, Shiba Inu could rocket 51% to the next level at $0.000014, a level last observed a year ago.
Shiba Inu’s Tokenomics and Community Engagement
Another strengthening in Shiba Inu’s upward trajectory is the enormous increase in the asset’s burn rate, which was stated to have soared by 4200% on February 22. This boost in the token-burning rate is a good signal for investors as it shows strong on-chain activity along with a conscious drop in the circulating supply of SHIB. Such strategic actions aim to increase investor trust and maintain asset prices in the market.
SHIB/USD Technical Analysis
On the SHIB/USD 24-hour price chart, the Bollinger bands are bulging and rising, with the upper and lower bands touching $0.00001011 and $0.00000883, respectively. This pattern suggests that the SHIB/USD pair is very volatile, with the potential for significant price movements in either direction. The rebounding candlesticks from the signal line indicate that buyers are moving in to support the price at crucial levels, perhaps leading to a breakout over the upper Bollinger band.
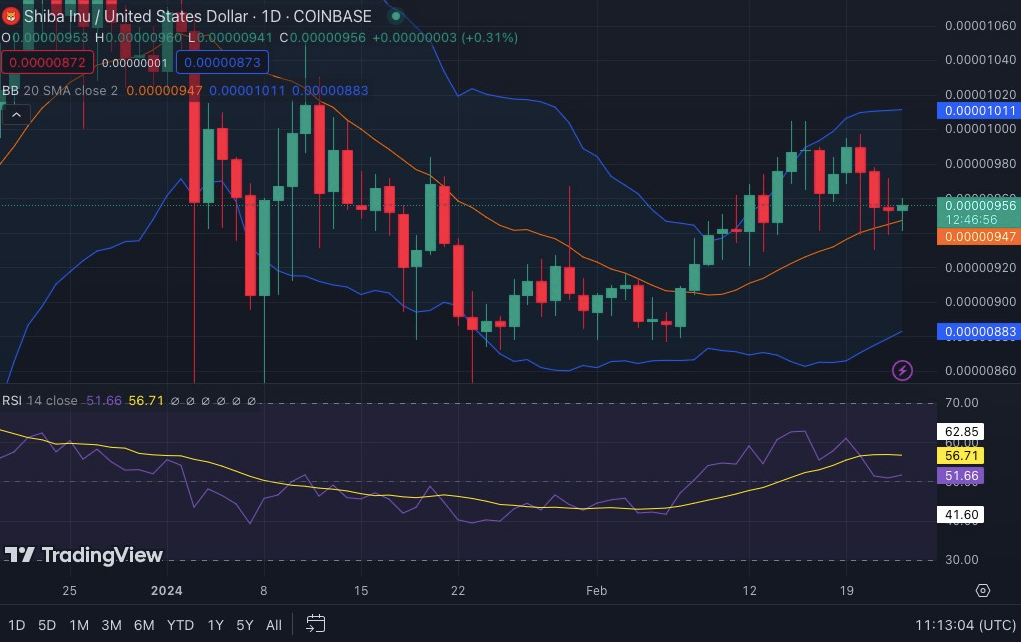
SHIB/USD 1-day price chart (source: Tradingview)
Furthermore, the Relative Strength Index (RSI) rating of 51.15, despite falling below the signal line, suggests that there is still an opportunity for a price rise before reaching overbought levels. This trend implies that the present rally may have more room to run before reversal. However, if the price continues to consolidate within the Bollinger bands without a clear breakout, it may signify a period of hesitation among traders, potentially resulting in a trend reversal.
Disclaimer: The information presented in this article is for informational and educational purposes only. The article does not constitute financial advice or advice of any kind. Coin Edition is not responsible for any losses incurred as a result of the utilization of content, products, or services mentioned. Readers are advised to exercise caution before taking any action related to the company.
: What Happens If You Use an Unlicensed Platform?")


