


- Glassnode recently highlighted the consistent growth in BTC’s realized cap over the past few halving events
- In their post, Glassnode also shared that BTC’s returns have diminished with each historical halving cycle.
- At press time, BTC was trading at $26,841.28 after a 0.31% gain.
In a tweet yesterday, the blockchain analytics firm glassnode shared that Bitcoin’s (BTC) Realized Cap has consistently increased over the past few halving events. Furthermore, the post stated that the current halving cycle bolstered a capital inflow of approximately $282.8 billion, which is a +200% increase from the previous cycle’s $102.3 billion.
Despite the growth in BTC’s Realized Cap throughout a previous couple of halvings, glassnode noted that each halving has produced diminishing returns. According to them, the current cycle only recorded a 362% expansion in size, which is a significant drop since the previous halving cycle with its 1,917% returns.
In related news, the price of BTC stood at $26,841.28 at press time after it experienced a 0.31% price increase in the previous 24 hours. Despite this daily gain, BTC’s weekly price performance remained in the red at -7.24%, according to CoinMarketCap.
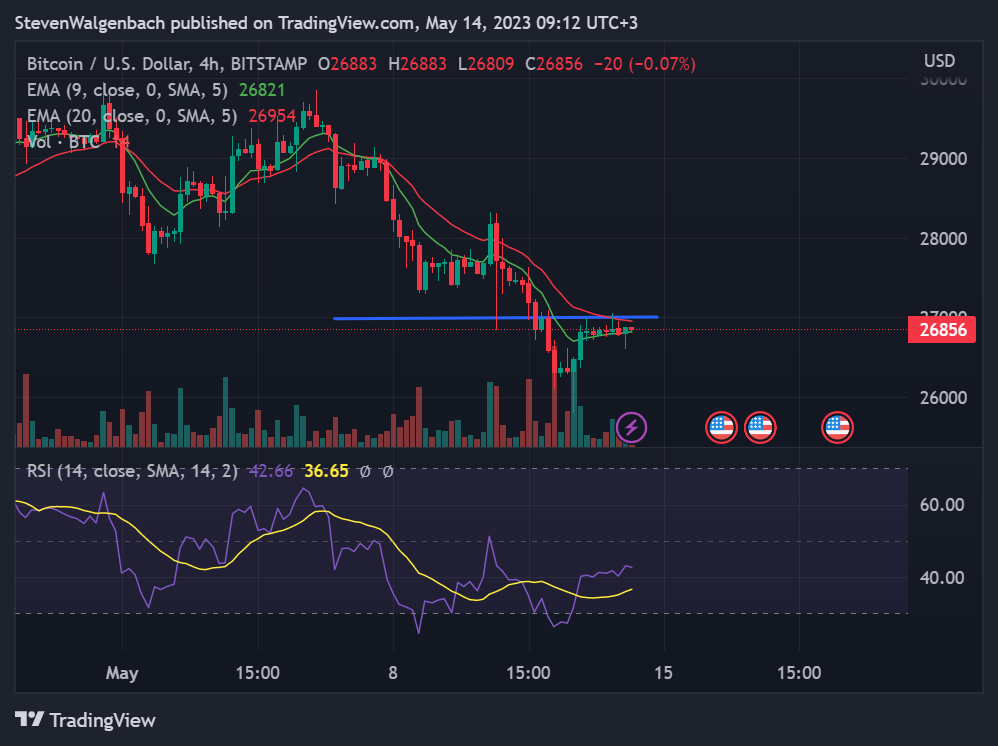
The $27K resistance level continued to stand its ground against the leading crypto’s price as BTC’s price failed to flip the level back into support over the past 24 hours. It was, however, able to reach a high of $27,052 yesterday evening. Unfortunately, the milestone was short-lived and the crypto’s price had retraced to a close of $26,853 just a few hours later.
BTC still has a chance of breaking above $27K in the next 48 hours, as it was trading above the 9 EMA line on the 4-hour chart at press time. Adding credence to this short-term bullish outlook is the fact that the RSI line on the 4-hour chart was trading above the RSI SMA line as well.
Disclaimer: The views and opinions, as well as all the information shared in this price analysis, are published in good faith. Readers must do their own research and due diligence. Any action taken by the reader is strictly at their own risk. Coin Edition and its affiliates will not be held liable for any direct or indirect damage or loss.
Disclaimer: The information presented in this article is for informational and educational purposes only. The article does not constitute financial advice or advice of any kind. Coin Edition is not responsible for any losses incurred as a result of the utilization of content, products, or services mentioned. Readers are advised to exercise caution before taking any action related to the company.
: What Happens If You Use an Unlicensed Platform?")


