


 Falls 5%: Will Bulls Get Back In the Game?")
- XRP dropped from $0.66 to $0.63 as bears continued to dominate the market.
- The bulls may need to beat the $0.67 resistance if there is any chance of reclaiming $0.70.
- XRP may fall to $0.60 if the price continues to weaken, as indicated by the EMA.
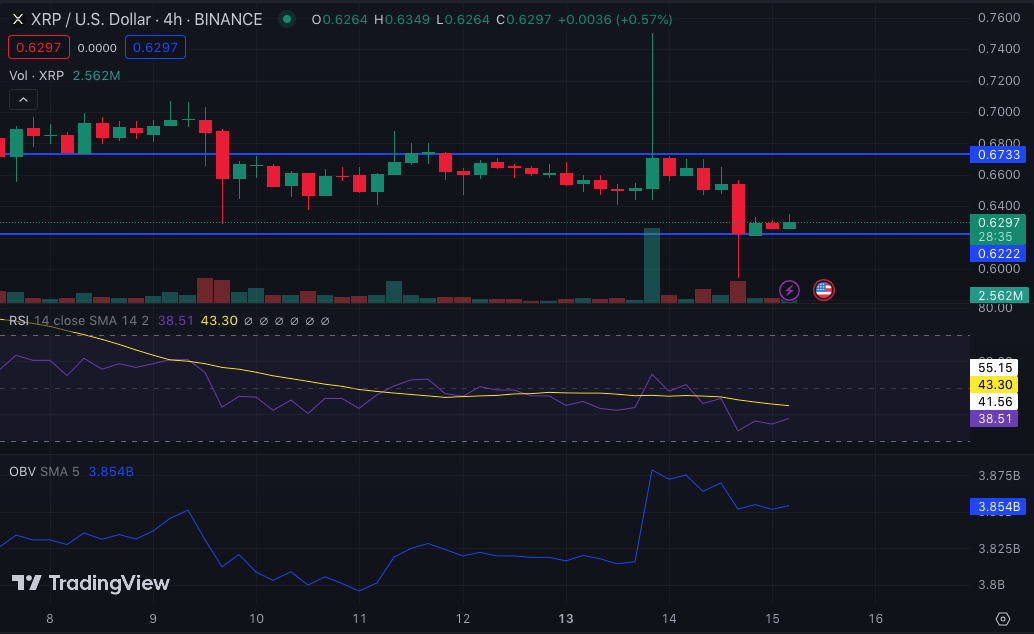
Ripple (XRP) printed red bars continuously as the price fell from $0.66 to $0.63, CoinMarketCap data revealed. This decline represents a 5.06% decrease in the last 24 hours. After observing the XRP/USD 4-hour chart, XRP was on its way to retesting the $0.65 level.
But to achieve a notable uptrend, buying strength needs to overwhelm selling pressure. A look at the Relative Strength Index (RSI) showed that the indicator was 38.51. Such a reading implies that sellers were in control on November 13, when the RSI dropped from 53.42. At the same time, the decrease in the RSI reading may present a buying opportunity for some traders.
If a rush of XRP accumulation appears at $0.62, then a jump above $0.65 could be on the radar in the short term. But if bulls were to target $0.70, the resistance at $0.67 needs to be passed.
Another Dip Before the Rise?
Also, the On Balance Volume (OBV) has flatlined since November 14. But at press time, the OBV was showing signals of moving northward. If the OBV continues to rise, it will reflect positive volume and may foreshadow a rising price for XRP.
But before a significant uptick, XRP may decrease a little, as indicated by the Exponential Moving Average (EMA). At the time of writing, the 50 EMA (yellow) had crossed over the 20 EMA (blue).
This movement suggests that the short-term Moving Average trend is losing strength. So, XRP’s price has the potential to remain weak. If this crossover is accompanied by high trading volume alongside a price fall, then XRP may finally decrease to $0.60. This is because rising volumes at a decreasing price are a sign of a potential downtrend.
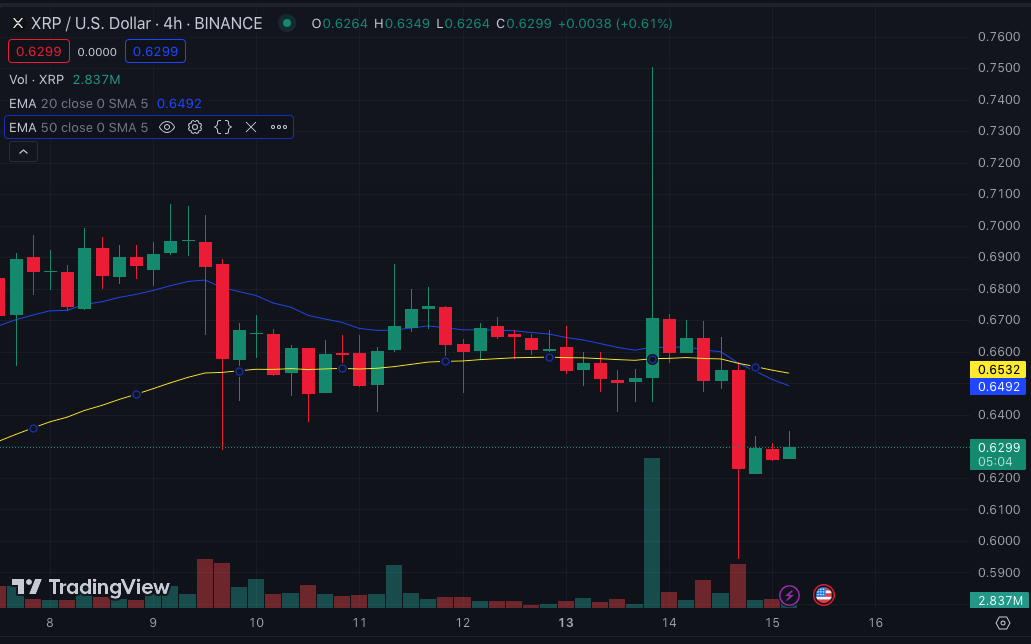
But if the trading volume continues to fall as it has in the last 24 hours, then $0.62 may be a good entry for those looking to make gains in the mid-term.
Disclaimer: The information presented in this article is for informational and educational purposes only. The article does not constitute financial advice or advice of any kind. Coin Edition is not responsible for any losses incurred as a result of the utilization of content, products, or services mentioned. Readers are advised to exercise caution before taking any action related to the company.
 Price Prediction 2026, 2027, 2028, 2029, 2030 -2050")


