


- RNDR rebounds with a bullish drive from $1.64 and eyes $1.71 resistance.
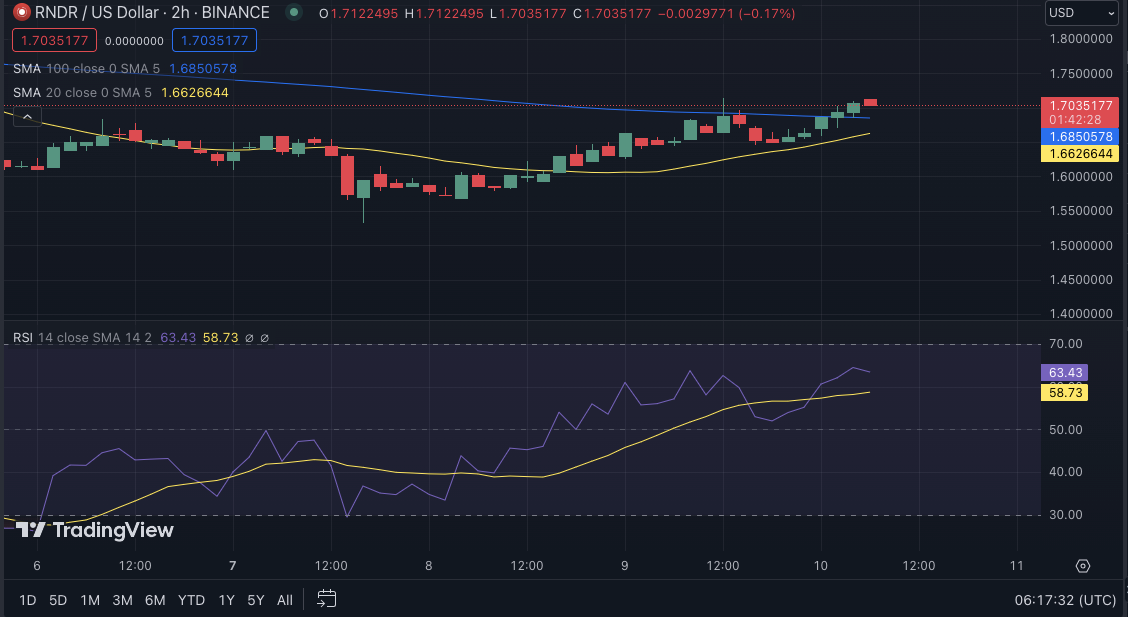
- Moving averages signal a strengthening of the RNDR uptrend.
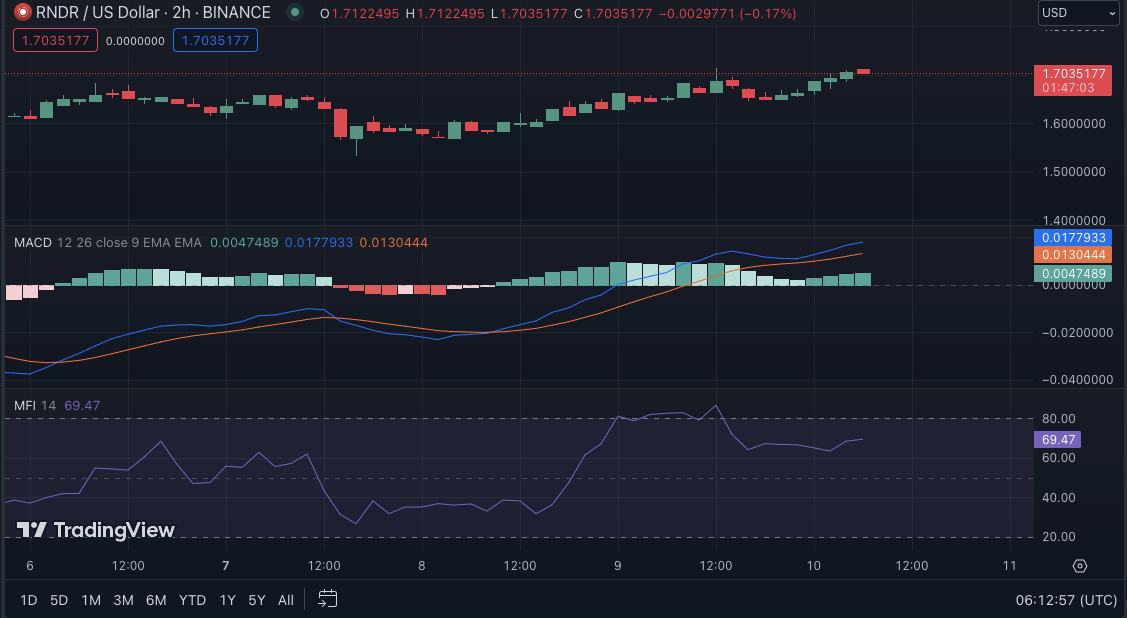
- MACD supports bullish momentum, however, high MFI warns of a potential correction.
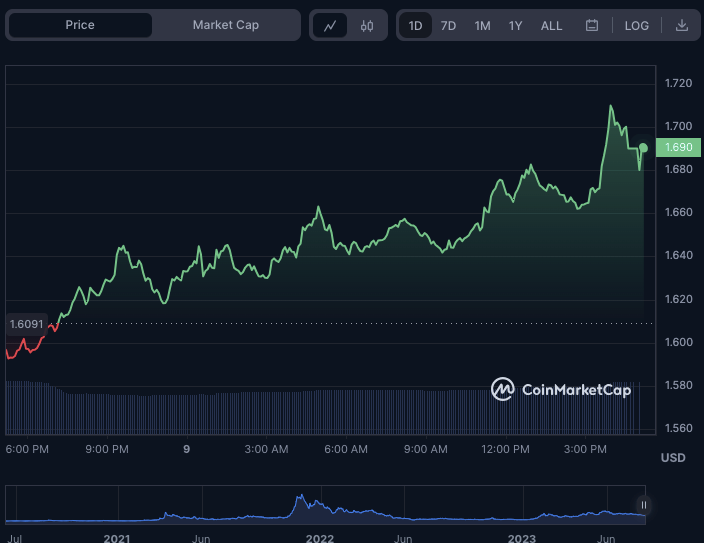
Render (RNDR) began the day with a bearish bias before bulls swooped in to aid its recovery after support was established at the 24-hour low of $1.64. As a result, bulls drove the RNDR price to an intraday high of $1.71 before hitting resistance.
RNDR was trading at $1.70 at the time of publication, a slight decrease from the previous high. Despite the opposition, overall sentiment remains positive as RNDR continues to show signs of growth.
RNDR’s market capitalization increased by 2.87% to $629,104,434 during the bullish recovery, while its 24-hour trading volume increased by 25.21% to $30,002,830, reflecting traders’ increased confidence in the token.
If RNDR bulls break through the $1.71 resistance, the next level to watch is around $1.85. This move would indicate that RNDR could continue to rise, potentially attracting more buyers to the market.
On the RNDR/USD price chart, the 100-day (blue) moving average moves above the 20-day (yellow) moving average, indicating that the bullish trend is strengthening. If the short-term MA crosses above the long-term MA, a golden cross is formed, a strong signal for traders to enter a long position. The 20-day and 100-day MAs are at 1.6850578 and 1.6626644, respectively, denoting the positive momentum.
The short-term momentum favors the bulls, with the 20-day moving average pointing upwards.
The Relative Strength Index is currently at 63.62 and pointing upwards, indicating that buying pressure is increasing, and market sentiment is improving. This level lends credence to the notion that more buyers will be drawn to the market, potentially driving prices higher. There is room for further gains before the market becomes overextended, as the RSI is still below the overbought threshold of 70.
The MACD trend is positive, with a reading of 0.0144236 supporting the bullish view. This movement indicates that buying momentum is strong and is likely to continue. Furthermore, the MACD histogram is increasing, indicating that the upward price movement is gaining traction.
Adding to the bullish momentum, the Money Flow Index rating of 69.47 indicates a higher inflow of money into the RNDR market, indicating intense buying pressure. This trend confirms the positive outlook and increases the likelihood of further price increases.
In conclusion, RNDR’s bullish momentum shows promise, but caution is advised as signs of potential consolidation and overbought conditions emerge.
Disclaimer: The views, opinions, and information shared in this price prediction are published in good faith. Readers must do their research and due diligence. Any action taken by the reader is strictly at their own risk. Coin Edition and its affiliates will not be liable for direct or indirect damage or loss.
Disclaimer: The information presented in this article is for informational and educational purposes only. The article does not constitute financial advice or advice of any kind. Coin Edition is not responsible for any losses incurred as a result of the utilization of content, products, or services mentioned. Readers are advised to exercise caution before taking any action related to the company.
 Price Prediction 2026, 2027, 2028, 2029, 2030 -2050")


