


- At press time, SHIB was attempting to challenge the $0.00000755 resistance level.
- SHIB was able to break above a medium-term negative trend line that had formed on its daily chart.
- SHIB’s price followed the rest of the cryptocurrency market and rose 3.97% over the past 24 hours.
The price movement of Shiba Inu (SHIB) coincided with the positive trend seen in the cryptocurrency market over the past 24 hours. According to data from the cryptocurrency market tracking website CoinMarketCap, the meme coin’s price was up 3.97%. This elevated its valuation to $0.000007418.
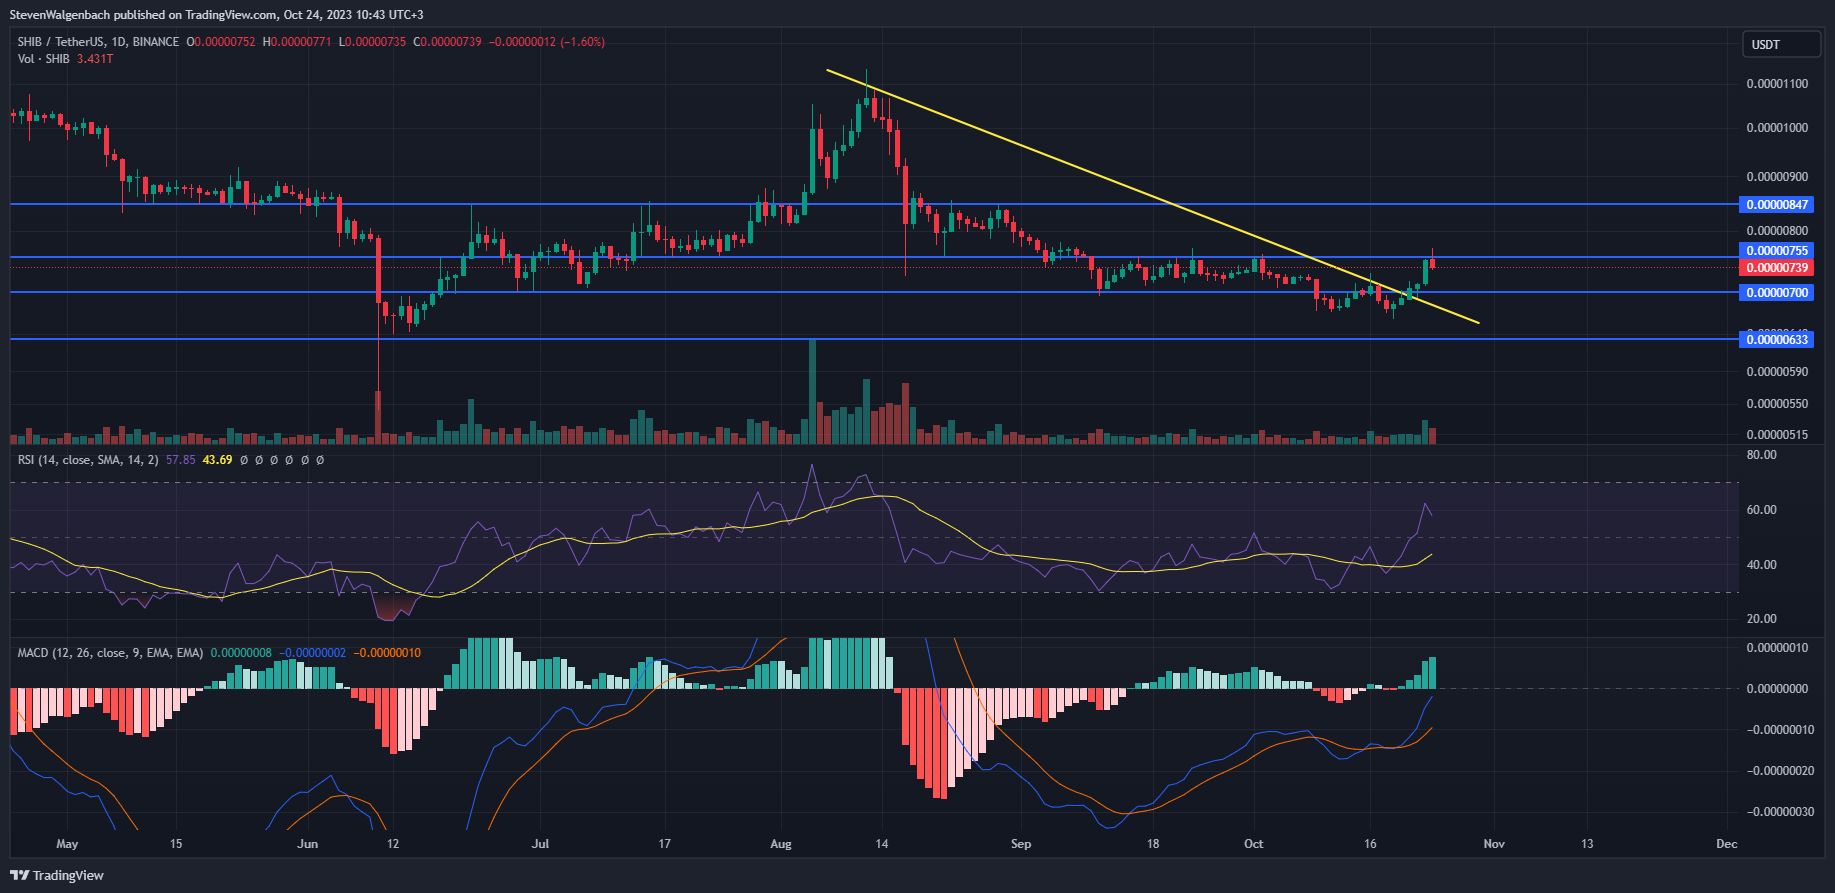
Daily chart for SHIB/USDT (Source: TradingView)
SHIB was able to break above a medium-term negative trend line that had formed on its charts throughout the past few months. Subsequently, the meme coin was able to flip the resistance level at $0.00000700 into support as well. The altcoin’s price then continued to rise over the past 48 hours and is currently attempting to break the $0.00000755 barrier.
Notably, SHIB was able to rise above this level briefly earlier in today’s trading session, but bears were quick to force it back down to trade below this price point at press time. If SHIB does not close today’s daily candle above this threshold, then it may be at risk of testing the immediate support level at the aforementioned $0.00000700 mark.
Thereafter, continued sell pressure could force the altcoin’s value below this point to the next support level at $0.00000633 in the short term. However, SHIB closing today’s trading session above $0.00000755 could invalidate the bearish thesis. In this more bullish scenario, SHIB may climb to as high as $0.00000847 in the upcoming few days.
Technical indicators on SHIB’s daily chart contradict each other at press time. Therefore, investors may want to wait to see if SHIB closes below or above $0.00000755 today before entering into a position.
The daily RSI indicator had formed a peak and sloped negatively towards oversold territory at press time. This could suggest that buyers were losing strength on SHIB’s daily chart. Meanwhile, the MACD line was breaking away above the MACD Signal line, which could indicate that SHIB’s positive trend was gaining momentum.
Disclaimer: The information presented in this article is for informational and educational purposes only. The article does not constitute financial advice or advice of any kind. Coin Edition is not responsible for any losses incurred as a result of the utilization of content, products, or services mentioned. Readers are advised to exercise caution before taking any action related to the company.
: What Happens If You Use an Unlicensed Platform?")


