


- The SHIB market is now supporting the bulls, with prices going higher.
- Shiba INU’s layer-2 solution, Shibarium, might be the catalyst for the SHIB price rally.
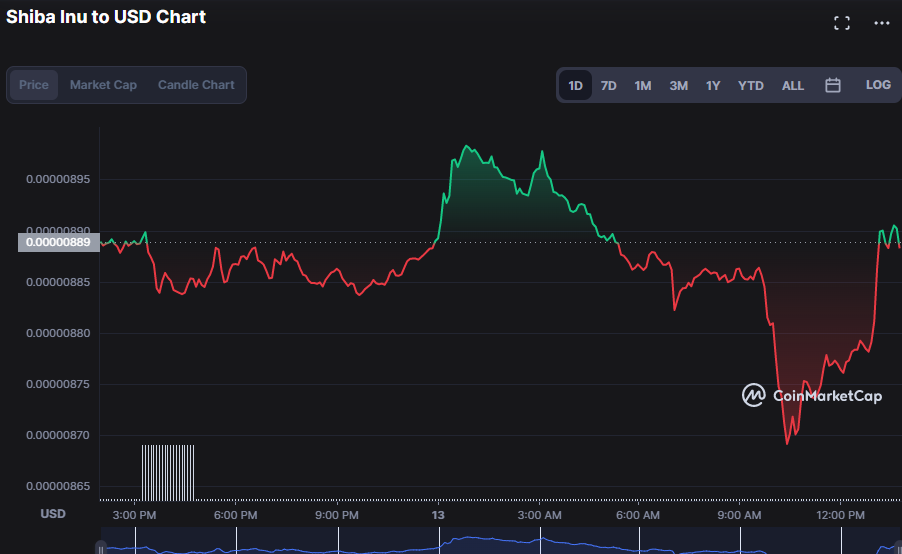
- Bears drove Shiba Inu prices down, but they finally stabilized around $0.000008684.
Shiba Inu’s (SHIB) upward momentum was short-lived as prices encountered intra-day resistance of $0.000008987. Bears controlled the market during the day, but as of press time, bulls were attempting to reclaim control, with prices rising by 3.63% to $0.000009187.
As the year winds down, bullish momentum is expected to take over the market as investors anticipate the release of Shiba INU’s layer-2 solution, Shibarium, whose sole purpose is to optimize the network on Ethereum with enhanced stability, faster transactions with fewer fees, and user-friendly metaverse and dApp development.
The advancing market capitalization by 0.26% to $4,892,316,509 further supports today’s positive trend; however, the declining trading volume of 19.04% to $116,924,107 dims this trend, implying that decreasing volume in an upswing may indicate that it’s time to sell and take gains.
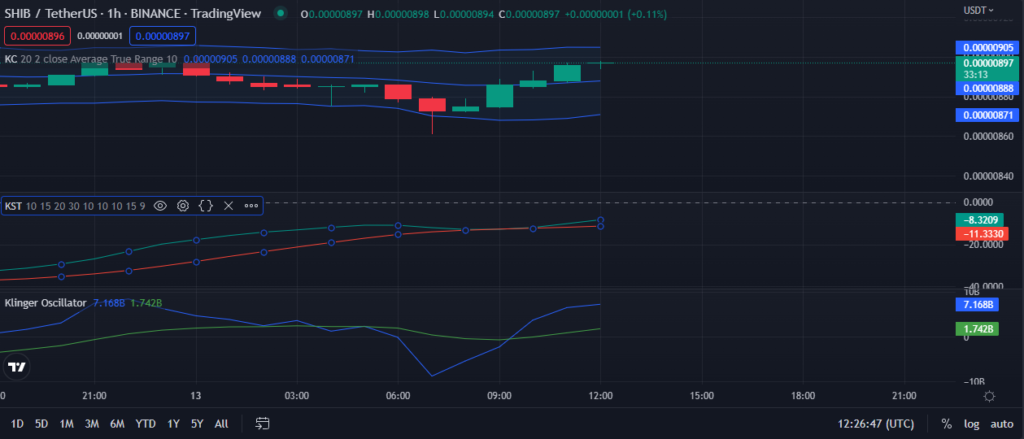
The rising Keltner Channel supports the SHIB market’s dominant bullish trend, with the upper band hitting 0.00000905 and the bottom band touching 0.00000871. As the price approaches the upper range, positive momentum may rise, and the uptrend may continue. The bullish engulfing candlestick developing on the price chart also supports this move.
By going over its simple moving average (SMA) line, the Know Sure Thing (KST) indicator shows that the bullish trend is getting stronger. Even if its reading is in the negative area (-8.4129), investors shouldn’t be too worried because the KST moves higher in the positive area as bull power grows.
The value of 7.008B on the Klinger Oscillator suggests a bullish trend, giving traders cause for confidence. The optimal time to enter long trades is when the Klinger line rises above the signal line. Hence its upward trend above its simple moving average line provides buyers confidence in the possibility of more gains.
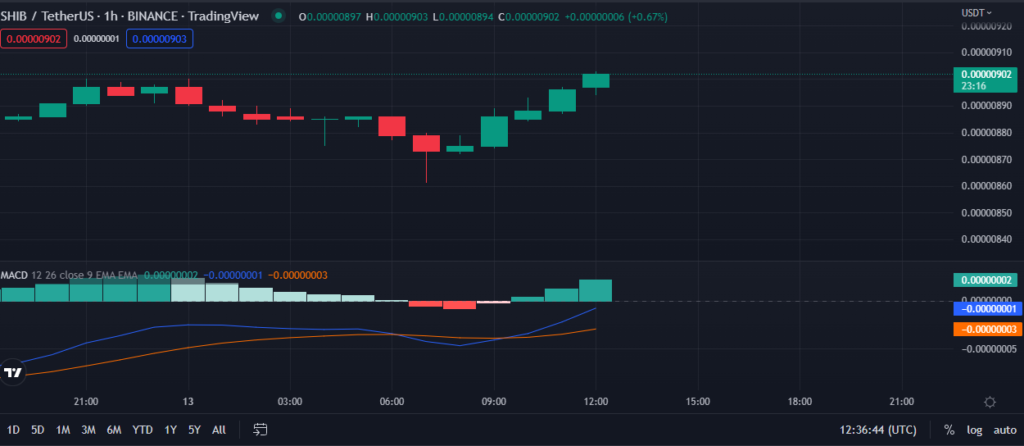
The histogram is now going higher, suggesting that buyers outweigh sellers. The MACD’s blue line is rising and is above the signal line with a level of -0.00000001; this is also a bullish indicator, implying that the bull’s run has yet to peak.
The present positive trend in the Shiba Inu (SHIB) market is projected to continue as long as the bulls continue to outpace any effort by the bears to grab the market.
Disclaimer: The views and opinions, as well as all the information shared in this price analysis, are published in good faith. Readers must do their own research and due diligence. Any action taken by the reader is strictly at their own risk, Coin Edition and its affiliates will not be held liable for any direct or indirect damage or loss.
Disclaimer: The information presented in this article is for informational and educational purposes only. The article does not constitute financial advice or advice of any kind. Coin Edition is not responsible for any losses incurred as a result of the utilization of content, products, or services mentioned. Readers are advised to exercise caution before taking any action related to the company.


