


 Flips Resistance: Next Stop $0.00001156?")
- SHIB’s bullish momentum could be validated if the price continues to close above the 9 and 20 EMAs.
- A rejection at $0.00000988 on the daily timeframe could send the price to $0.0000088.
- An increase in volatility and buying pressure might trigger a jump beyond $0.00001156.
Shiba Inu’s (SHIB) price action since February 7 has shown that the token could soon be completely out of its bearish phase. Between January and February 6, SHIB’s trend was downward, as the price went from $0.00000934 to $0.00000890.
However, a few days later, SHIB breached the $0.00000934 resistance, in preparation for the next leg up. This climb validated the bullish thesis and sent the price as high as $0.00000963. If there is a spike in selling pressure, SHIB might retrace to $0.00000915.
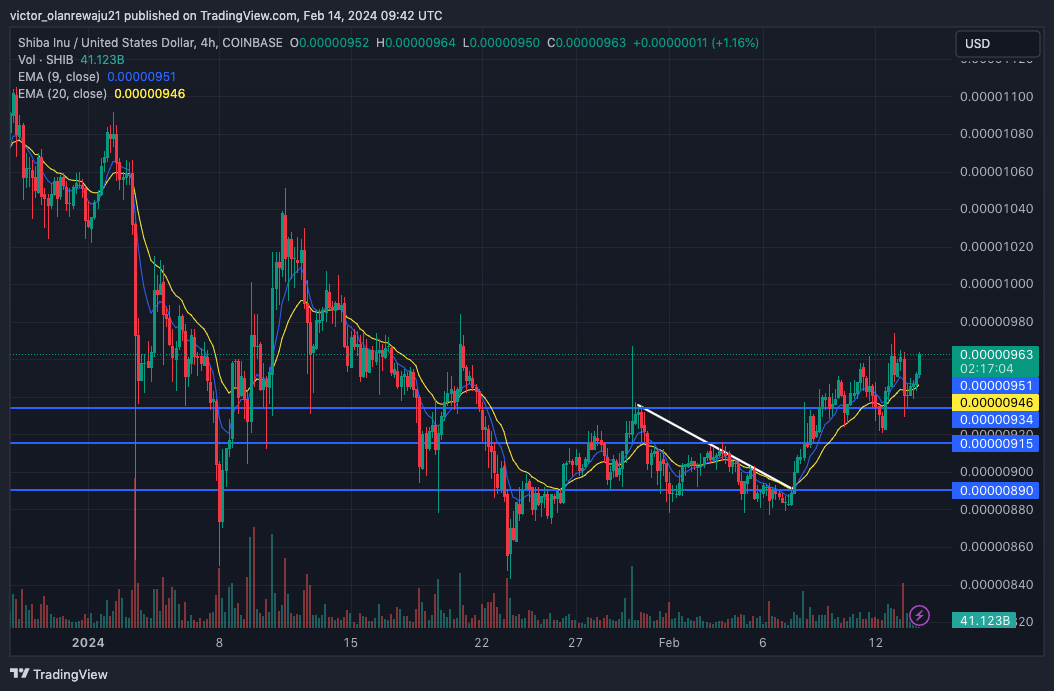
SHIB/USD 4-Hour Analysis
But indications from the 4-hour chart showed that the cryptocurrency seemed prepared for another uptrend. The 9 EMA (blue) closed at $0.00000951 at press time. The 20 EMA (yellow), on the other hand, closed at $0.00000946.
A position like this is considered bullish, and since SHIB’s price broke above both levels, a higher price could be in the works. If the 9 EMA keeps the golden cross and stays above the 20 EMA, a 20% jump for SHIB could happen within a few days. Should this be the case, SHIB’s price might delete a zero and rise to $0.00001156.
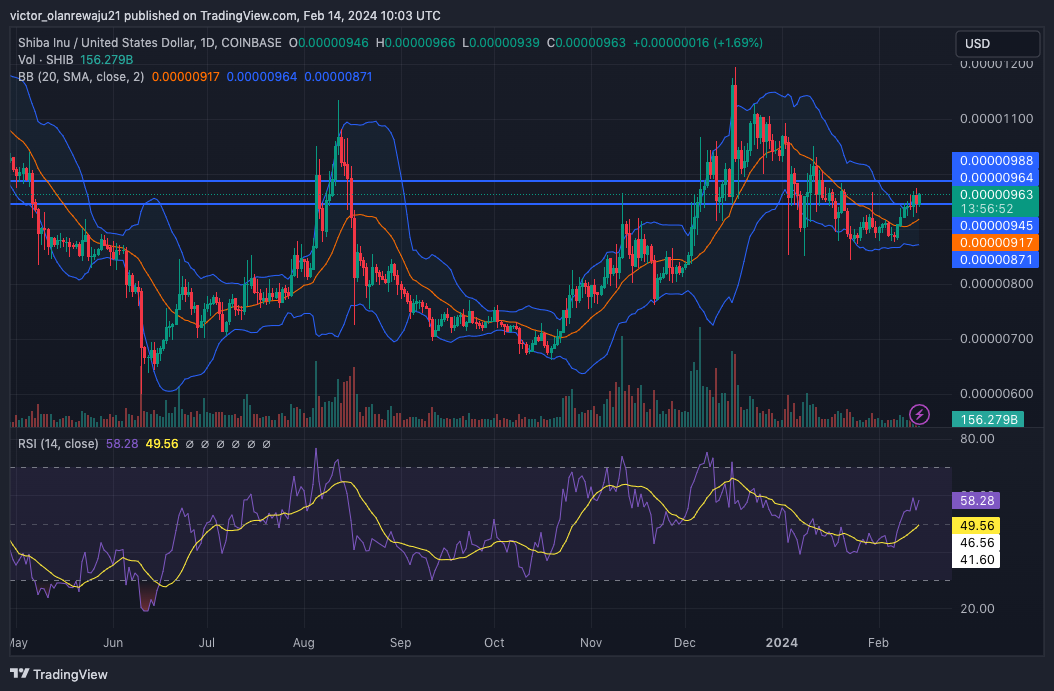
SHIB On the Daily Timeframe
On the daily timeframe, SHIB had initially been pegged back to $0.00000947. However, bulls seemed determined to help the price hit $0.000010 for a start. To achieve that, SHIB needs to stay above the $0.00000945 support.
Also, buying pressure has to be intense to help SHIB move past the $0.00000988 resistance. A successful close above the resistance might send SHIB above $0.000010. But if the Shiba Inu native token gets rejected again, it could slide to $0.00000885.
For SHIB to rise as high as $0.000011, volatility has to increase. At press time, the Bollinger Bands (BB) showed that the bands contracted. This could make it difficult for SHIB’s price to significantly extend its gains.
Furthermore, the Relative Strength Index (RSI) had increased to 58.28, suggesting increased buying momentum. An increase in buying pressure might spark an increase in volatility which could lead to major price fluctuations.
In a highly bullish situation, SHIB’s price might rally to $0.00001156. However, if market players decide to start taking profits, the value might shrink. In this instance, a decline to $0.0000088 could be next.
Disclaimer: The information presented in this article is for informational and educational purposes only. The article does not constitute financial advice or advice of any kind. Coin Edition is not responsible for any losses incurred as a result of the utilization of content, products, or services mentioned. Readers are advised to exercise caution before taking any action related to the company.
 Price Prediction: Can BTW Sustain Its Breakout Above $0.1032?")


