


- USDC’s volume on the Solana blockchain hit $70 billion since the start of November.
- The rise in SPL token swaps had a hand in the increase in transaction volume.
- An entry around $57.72 could favor traders looking to long the cryptocurrency.
According to Jeremy Allaire, Solana’s (SOL) volume involving the USDC stablecoin has reached $850 billion on a Year-To-Date (YTD) basis. Allaire, who is the co-founder and CEO of Circle, the firm in charge of issuing the USDC coin, made this known in a post on X.
The Circle CEO noted that the transaction volume was impressive especially as $70 billion out of the total took place in November.
Solana and USDC’s integration goes as far back as 2020. At that time, the goal was to improve adoption using tokens built using the Solana Program Library (SPL). Since then, most swaps on the Solana blockchain have been done using USDC primarily.
More Tokens, More Volume
This year, specifically around September, both projects collaborated with payment giant Visa to engage in stablecoin global settlement. However, the recent surge in transaction volume is not necessarily related to the stablecoin settlement but to the surge in SPL transactions and the hike in SOL’s price in recent times.
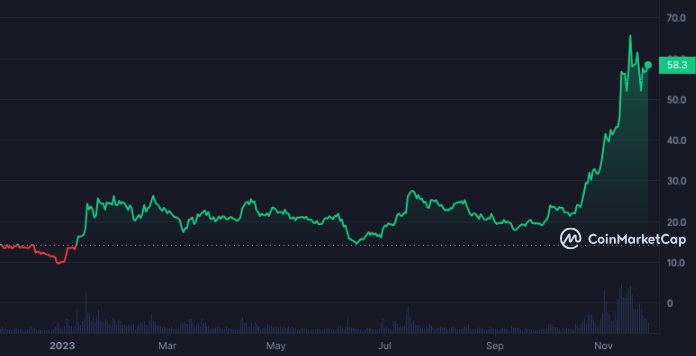
For instance, Coin Edition reported about Pyth Network [PYTH] whose price rose tremendously moments after its official launch. SOL, on the other hand, has had an incredible year.
Now ranked as the sixth most valuable cryptocurrency, SOL’s value has increased by 304% in the last 365 days. In fact, no other asset in the top 20 per market value came close to the token’s performance.
SOL to Recover to $60?
On the 4-hour timeframe, the 0.236 Fibonacci retracement level was around $57.72. Although SOL has been undergoing a mild correction, the $57.72 can prove to be a significant support level.
Should the SOL price continue to decrease from $58.01, there is a likelihood of a bounce if it reaches $57.72. So, short-term traders with the intention to open a long position may look for an entry around $57.75 to $57.80.
With respect to the Relative Strength Index (RSI), the 4-hour charts showed that the indicator had decreased to 51.20. On November 25, the RSI reading was 58.22, indicating that bulls had attempted to drive the SOL price up.
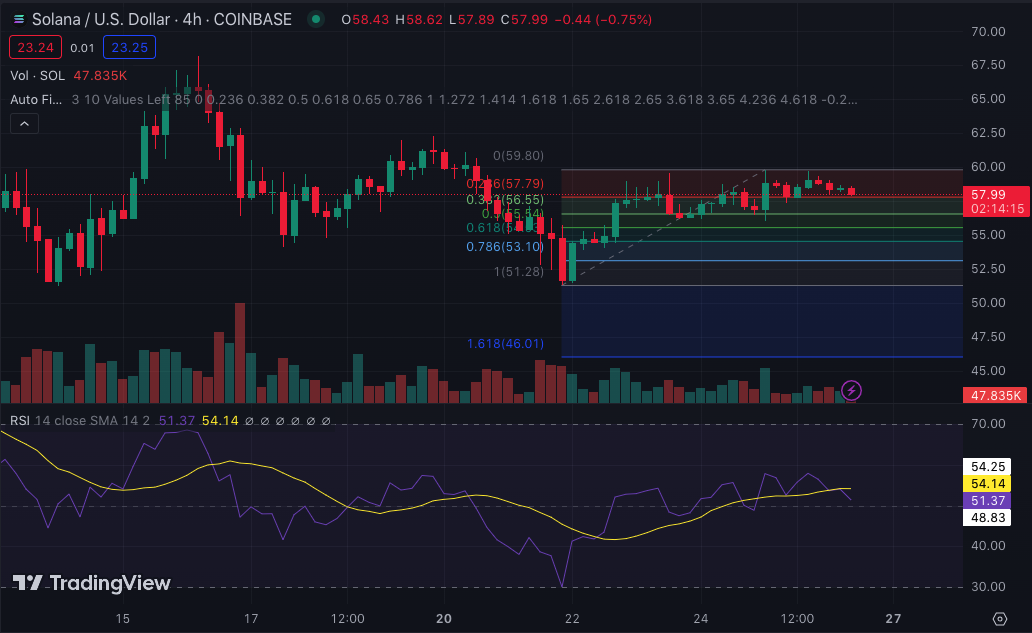
So, the fall in the reading implies that the buying momentum waned in the last 24 hours. As it stands, SOL may continue to move sideways. If the buying pressure fails to resume, SOL may drop below $57.85. However, an increase in the buy orders may send the cryptocurrency back above $60.
Disclaimer: The information presented in this article is for informational and educational purposes only. The article does not constitute financial advice or advice of any kind. Coin Edition is not responsible for any losses incurred as a result of the utilization of content, products, or services mentioned. Readers are advised to exercise caution before taking any action related to the company.


