


 Bullish Run Continues, Technical Indicators Show Strong Momentum")
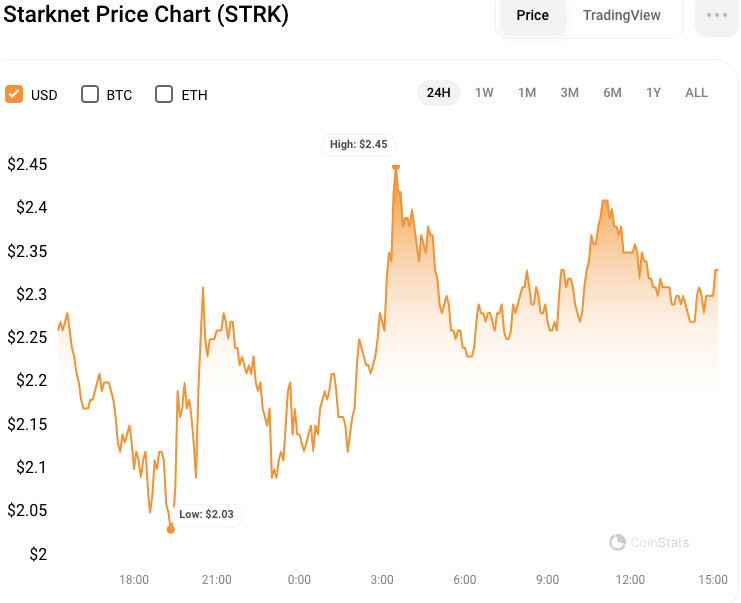
- Starknet’s price leap to $2.45 marks a 4% gain amidst broader market challenges.
- STRK breaks through the $2.188 barrier, eyeing the next milestone at $2.50.
- Technicals hint at Starknet’s momentum, with MACD and RSI backing a bullish trend.
The cryptocurrency market witnessed a notable surge in Starknet’s value, with an over 4% increase pushing its price to $2.45. This rise comes as a surprise, especially given the prevailing market downturn that has seen many investors turning cautious.
Starknet, however, has defied the odds, capturing the interest of the crypto community and prompting a rush among investors to acquire the digital asset.
Breaking Through Resistance Levels
During the trading session, Starknet achieved a significant milestone by breaking through the $2.188 resistance level. This achievement was marked on its 4-hour chart, showcasing a pattern of higher lows and higher highs that signal a robust bullish momentum.
The positive trajectory formed a promising price channel, suggesting that Starknet could soon surpass the $2.50 mark. A sustained closure above this threshold could solidify its position and set the stage for further gains.
However, the optimism surrounding Starknet’s performance comes with a caveat. Should the cryptocurrency fail to maintain its position above the $2.350 mark in the subsequent 24 hours, it might face a period of consolidation or correction. The $2.188 support level becomes crucial in this scenario, as a dip below could trigger a significant market correction, potentially driving prices down to $1.904 or even $1.712.
Technical Indicators Favor Bullish Sentiment
Despite these potential challenges, technical indicators on Starknet’s 4-hour chart reinforce the bullish sentiment. The Moving Average Convergence Divergence (MACD) presents a positive outlook, with its line advancing above the signal line. This development is typically interpreted as a sign of strengthening bullish momentum, although the leveling off of the MACD histogram suggests a possible peak in this trend.
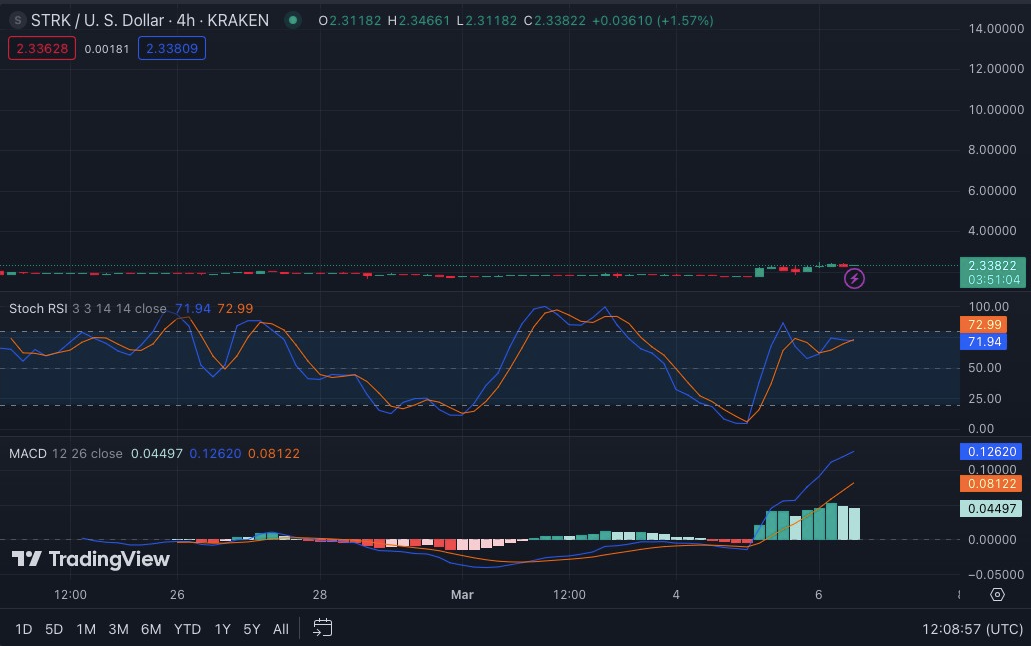
Furthermore, the stochastic RSI rating of 72.75, which is going below its signal line, suggests that there may be some short-term consolidation or a minor pullback before the rising trend can resume. If the price remains above critical support levels, such as the 50-day moving average, it may imply that the bullish trend will continue. Traders should look for signs of weakness or a break below these levels, as this could indicate a shift in market mood.
Disclaimer: The information presented in this article is for informational and educational purposes only. The article does not constitute financial advice or advice of any kind. Coin Edition is not responsible for any losses incurred as a result of the utilization of content, products, or services mentioned. Readers are advised to exercise caution before taking any action related to the company.

: What Happens If You Use an Unlicensed Platform?")


