


- STX and ORDI showed a strong correlation with BTC as the prices rallied.
- STX might kickstart a correction to $1.76 if BTC drops below $50,000.
- ORDI’s bearish thesis could be invalidated if it stays above the 9 and 20 EMAs.
Bitcoin’s jump above $50,000 has positively affected the prices of Stacks (STX) and Ordi (ORDI). According to data from CoinMarketCap, STX’s price increased by 6.19% in the last 24 hours and retested $2.
Meanwhile, ORDI registered a 15.20% increase, surging past $70. Both ORDI and STX have links to Bitcoin. For Stacks, its fundamentals as a layer two (L2) on the Bitcoin network meant its price has a strong correlation with the number one cryptocurrency.
Likewise, Ordi’s position as the top BRC-20 token indicates that when BTC climbs, it follows. Also, when the coin plunges, historical data shows that projects linked to it face correction.
Stacks (STX) Price Analysis
STX’s 4-hour chart suggested there was further upside potential. At press time, STX was at $1.98, after trading with a bullish bias.
Supporting a continued bullish trend is the Awesome Oscillator (AO) indicator. As of this writing, the AO was 0.16 with green histogram bars, indicating increasing upward momentum for STX. Should the AO reading remain positive, STX might jump above $2 once more.
However, this might also depend on BTC’s movement. If Bitcoin stays above $50,000 or rises as high as $52,000, STX’s price could jump by another 10%. But if Bitcoin drops below this threshold, STX’s price might also decrease.
Meanwhile, volatility around STX has been increasing as shown by the Bollinger Bands (BB). STX tapped the upper band of the BB at $1.98, suggesting that STX could be overbought.
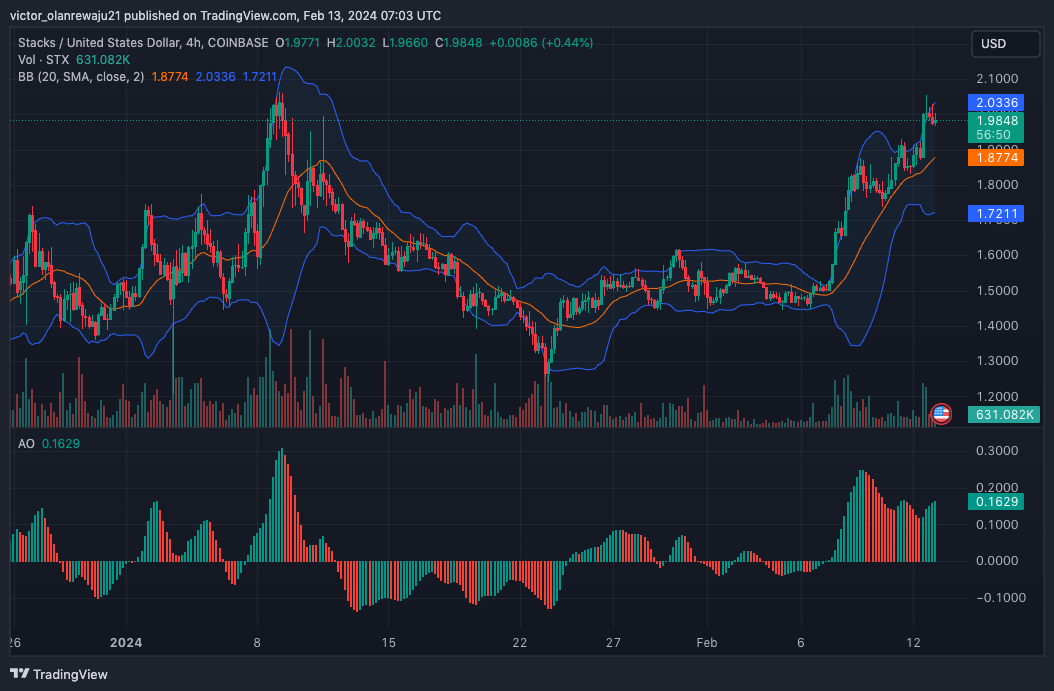
Increasing volatility from a bearish point of view could trigger a dump to $1.76. However, in a highly bullish case, buying pressure might lift STX to $2.10.
Ordi (ORDI) Price Analysis
ORDI’s break above the $65.19 overhead resistance was proof that bears were finding it difficult to pull down the price. Bulls did not relent, and brought ORDI above $70.
On the 4-hour chart, there was a minor resistance at $70.90. If that level is crossed, the ORDI/USD pair could accelerate as high as $80. But like STX, this potential also depends on Bitcoin’s price action.
A rally for BTC might push ORDI close to $80. On the contrary, the price might plummet if bulls fail to defend BTC at $50,000. Should this happen, ORDI’s price might fall to $61.23. In the meantime, the price had closed above the 9 EMA (blue) and 20 EMA (yellow).

This confirms a bullish thesis for the token. If ORDI stays above the EMAs, then it could rise in the $80 direction. However, a close below either the 9 or 20 EMA might send the price downwards.
Disclaimer: The information presented in this article is for informational and educational purposes only. The article does not constitute financial advice or advice of any kind. Coin Edition is not responsible for any losses incurred as a result of the utilization of content, products, or services mentioned. Readers are advised to exercise caution before taking any action related to the company.


