


- Tether Operations Limited’s statement sets the tone for TRON investors.
- According to recent data, digital currency has been on an upward trajectory.
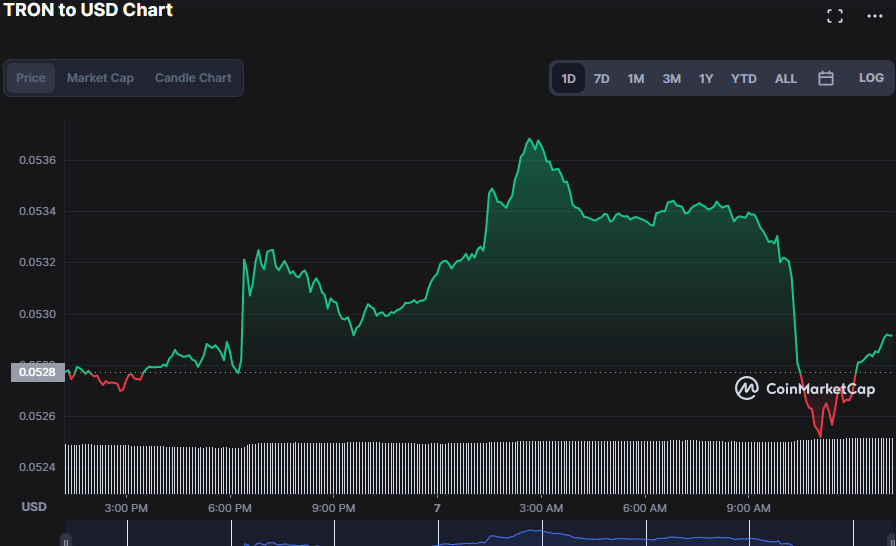
- TRX market has found support in the previous 24 hours at $0.05251.
The TRON (TRX) market was taken over by bears, with prices retreating to a low of $0.0527 after opening the day at $0.0528. However, bulls came in to loosen the bears’ hold on TRX, sending prices rising until they hit resistance at $0.05369.
Bulls were successful in hiking TRX prices to $0.05311, a 0.69% bump, during the rally. Yesterday, Tether Operations Limited announced the addition of an offshore Chinese Yuan (CNHT) to the TRON blockchain. This action attracted investors, resulting in a 0.36% and 11.89% increase in market capitalization and 24-hour trading volume, respectively, reflecting elevated market volatility.
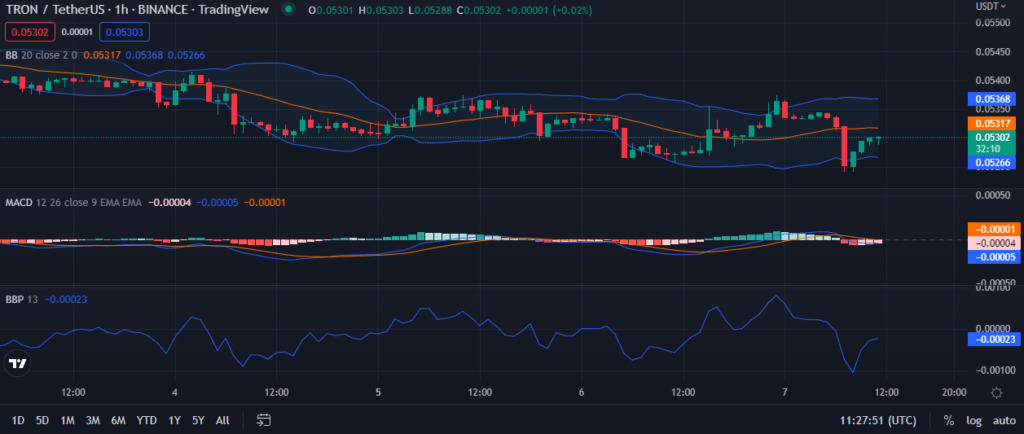
Market stability is achieved as the Bollinger bands move in a linear fashion, with the top band touching 0.05368 and the lower bands touching 0.05266. This action suggests that the market’s purchasing and selling pressures are balancing, implying that a new bull run is on the way. However, the market’s price movement towards the lower band casts doubt on this assumption, warning traders to be wary.
The MACD blue line’s movement below the signal line and into the negative zone with a value of -0.00005 also serves as a warning to traders. The histograms’ negative trend also warns traders that a turnaround may be on the way if the bull does not continue to fight.
The negative trend of the Bull Bear Power (BBP) of -0.00023 indicates that bear power is escalating. However, its northward movement as it attempts to exit negative territory provides some optimism for an additional bull run.
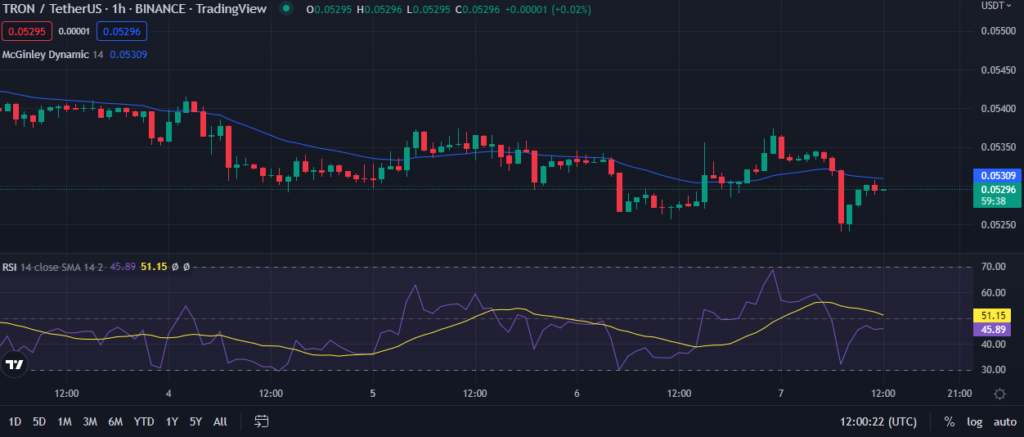
The McGinley indicator on the 1-hour price chart is reading 0.05311 and is going below the market price, signaling that bear momentum is on the way.
This bearish viewpoint is supported by the RSI value of 46.31, which indicates that selling pressure is greater than purchasing pressure. Traders should be wary in the short term since the RSI has fallen below 50 and the price has fallen below the McGinley indicator, suggesting that the investment is a sell.
Although bulls still sway in the ICP market, a protracted upward trend is not guaranteed according to technical indicators.
Disclaimer: The views and opinions, as well as all the information shared in this price analysis, are published in good faith. Readers must do their own research and due diligence. Any action taken by the reader is strictly at their own risk. Coin Edition and its affiliates will not be held liable for any direct or indirect damage or loss.
Disclaimer: The information presented in this article is for informational and educational purposes only. The article does not constitute financial advice or advice of any kind. Coin Edition is not responsible for any losses incurred as a result of the utilization of content, products, or services mentioned. Readers are advised to exercise caution before taking any action related to the company.


