


 After Its Eventual Fall?")
- Liquidity increased, and the divergence with the price could trigger an uptrend.
- BCH’s buying momentum increased but risks a retracement if the BB continues to touch the price around $234.79
- The MACD signaled a possible bullish market structure provided the indicator rises upwards
Bitcoin Cash (BCH) posted a 7.48% decrease in the last seven days, indicating how the highs recorded in June have become a thing of the past. The fall in value ensured that BCH’s 90-day performance, which was once well above 130%, shrunk to 92.38.
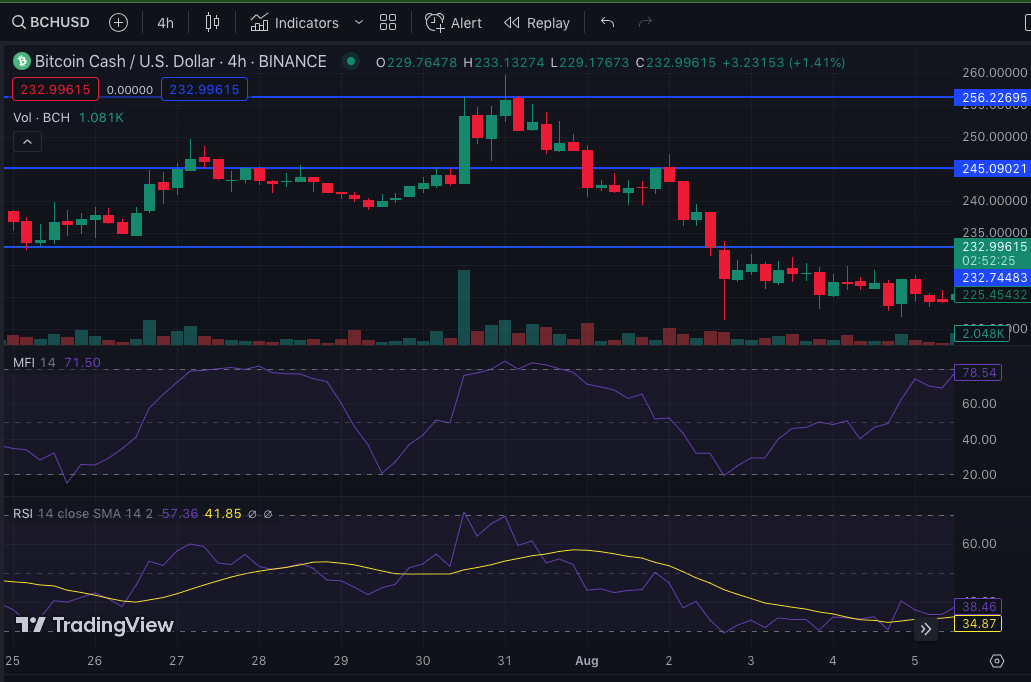
While traders may be hoping for a reversal in trend, the BCH/USD 4-hour outlook shows otherwise. According to the chart displayed below, BCH’s market structure has been bearish since the coin hit $256.27 on July 31.
BCH: Turning Bear to Bull
Furthermore, its bearish nature could be linked to a series of selling pressure at $245.09 and $232.18. Although there were mild upswings in between these drops, bullish sentiment failed to prevail despite a retest of $232.74.
However, indications from the Money Flow Index (MFI) suggest that BCH had a relatively good flow of liquidity coming into the market. But there was a divergence between the MFI and BCH’s prices.
At press time, the MFI had risen to 71.49 while the price was in between decreasing and falling flat. If the divergence continues to exist, then BCH has the tendency to trend in an upward trajectory. But if the MFT retraces and follows in the same direction as the price, it will be a confirmation of a continuous downtrend.
Furthermore, the Relative Strength Index (RSI) was 56.48. Since the RSI was above the midpoint, it implies that BCH’s buying momentum was solid. If the indicator continues to maintain the said level or rises above it, then BCH could increase as high as $250.
Also, the Bollinger Bands (BB) indicated that BCH’s volatility has reached extreme levels. In addition, the BB also indicated that the coin was overbought since the upper band touched the price at $234.79.
Rising Above Potential Retracement
Previously, the lower band had touched the price at $221.17, suggesting that BCH was oversold on August 7. Therefore, the current stance of the BB signals that BCH might retrace.
Concerning the Moving Average Convergence Divergence (MACD), the 4-hour chart showed that it was 1.84. Positive values of the MACD signal increasing upward momentum. This means that the 12-day Moving Average (MA) is above the 26-day MA, indicating a potential bullish momentum.
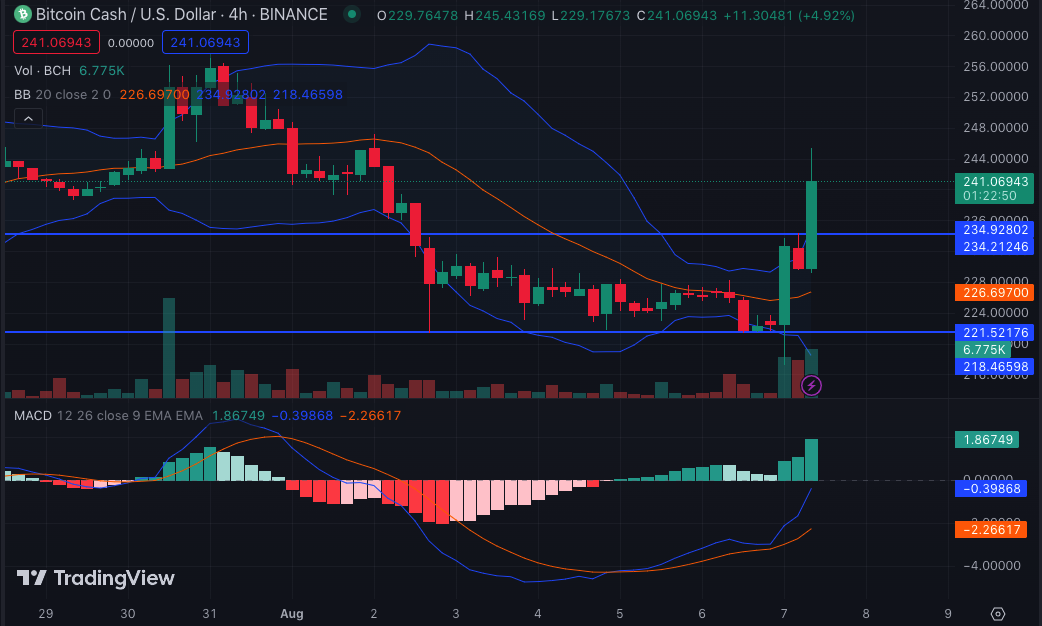
If the MACD continues to rise in the positive territory, then BCH’s next movement could be upwards. Also, if buying pressure dominates the sell orders, BCH might override the signal shown by the Bollinger Bands.
Disclaimer: The views, opinions, and information shared in this price prediction are published in good faith. Readers must do their research and due diligence. Any action taken by the reader is strictly at their own risk. Coin Edition and its affiliates will not be liable for direct or indirect damage or loss
Disclaimer: The information presented in this article is for informational and educational purposes only. The article does not constitute financial advice or advice of any kind. Coin Edition is not responsible for any losses incurred as a result of the utilization of content, products, or services mentioned. Readers are advised to exercise caution before taking any action related to the company.
 Price Prediction 2026, 2027, 2028, 2029, 2030 -2050")


