


 Correction Could Be a Buy Signal Before $3")
- RNDR outperformed BTC as whale interaction and social dominance around the project rose.
- November could prove to be a good month for RNDR because of the budding AI narrative.
- A buy signal appeared at $2.44 which could serve as the support zone for RNDR to reach $3.
Render (RNDR) was one of the altcoins in the spotlight following a period when Bitcoin (BTC) tapped $35,000. At the time of writing, the price of RNDR was $2.48 after a showstealing 64% hike in the last 30 days.
Santiment, an on-chain analytic platform was able to identify reasons for Render’s exponential growth within the aforementioned period. According to Santiment, RNDR was a beneficiary of increased network growth, activity, and whale interaction. Due to these activities, the token’s social dominance reached its highest within the same timeframe.
More Expectations for the RNDR Price
Typically, a combination of these metrics listed above is a sign that a project is getting increased attention and adoption from the market. Also, the effect on the price action is usually positive, which is what RNDR has displayed.
Despite the tremendous price increase, RNDR may still possess the potential to increase again in November. One of the reasons for this is because of the fundamentals behind the project. For context, RNDR serves as the utility token for Render, whose focus is on distributing idle computational power for rendering from Graphic Processing Unit (GPU) providers.
Because of this, RNDR is categorized under the tokens connected to Artificial Intelligence (AI) tokens since GPUs are fundamental to deep-learning models. When November begins, there will be a lot of conferences related to AI. So, there is a chance that cryptocurrencies like RNDR may build on the narrative, and perform well during the month.
Lows Before Another High
RNDR/USD 4-hour chart showed that the token was undergoing a period of correction. This trend was expected considering how little profit-taking had been seen during the period of growth from $2.10 to $2.59.
However, the Relative Strength Index (RSI) had dropped to 5.06 at press time. For a reading that was as high as 97.60 on 29 October, the fall indicates that RNDR was beginning to get oversold.
By default, values of the RSI over 80 means the asset is overbought. Conversely, values below 20 mean it’s oversold. Furthermore, the bearish RNDR trend is a buy signal that could change the price direction.
If buying pressure increases at the support created at $2.44, RNDR may eye new heights. Considering the market momentum, the token has the potential to jump above $2.70 while approaching $3.00.
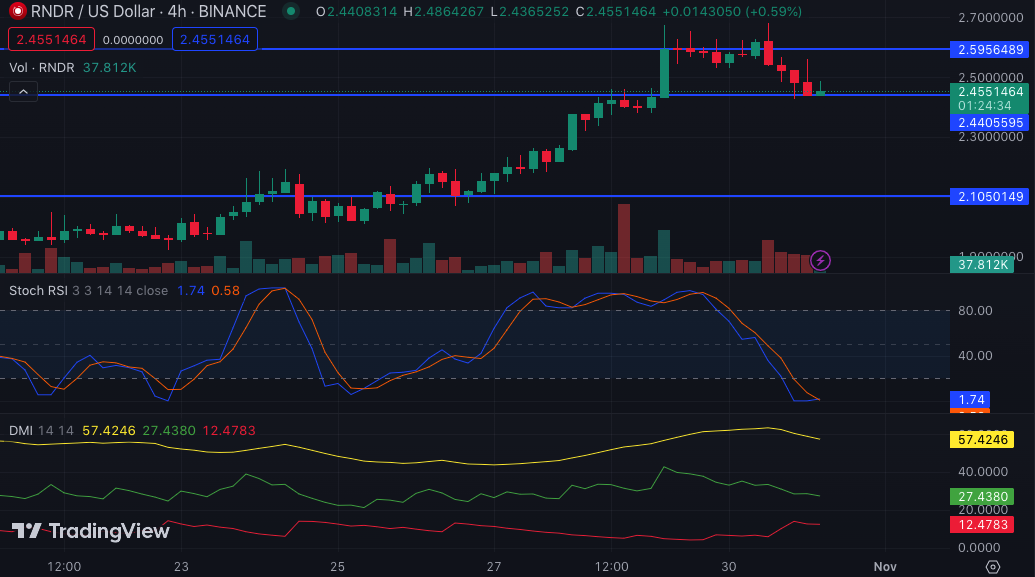
Another indicator supporting the bullish thesis is the Directional Movement Index (DMI). As shown above, the +DMI (green) was 27.43. On the other hand, the -DMI (red) was 12.47. The difference in these indicators is a confirmation that selling strength was not as much as buying momentum.
Therefore, RNDR may begin to rise in the upward direction soon. This bias was also supported by the Average Directional Index (ADX). The ADX (yellow) was 57.24, indicating a strong directional movement for RNDR on the upside sooner or later.
Disclaimer: The information presented in this article is for informational and educational purposes only. The article does not constitute financial advice or advice of any kind. Coin Edition is not responsible for any losses incurred as a result of the utilization of content, products, or services mentioned. Readers are advised to exercise caution before taking any action related to the company.


