


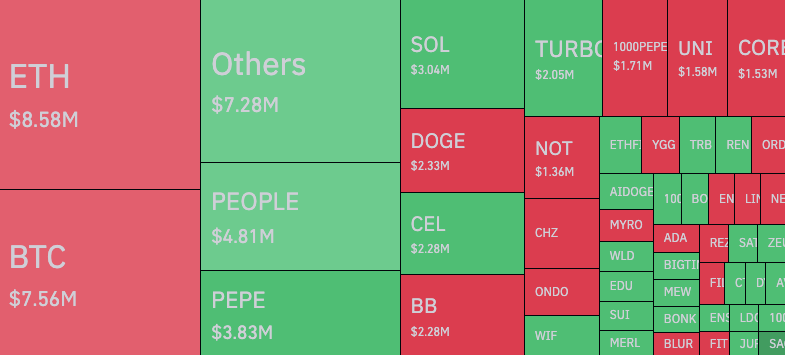
- BTC and ETH liquidations summed up to $16.14 million in the last 24 hours.
- The shorter and longer EMA were almost at the same spot, indicating possible BTC consolidation.
- ETH’s momentum decreased, suggesting that the price might fall to $3,437.
The prices of Bitcoin (BTC) and Ethereum (ETH) ended the just-ended week on a positive note. As a result, the last 24 hours were tough for traders who leaned toward bearish sentiment and bet on their conviction.
According to derivatives information portal Coinglass, over $62 million was liquidated on May 25. Out of this ETH positions were valued at $8.58 million. BTC contracts wiped out, on the other hand, were worth $7.56 million.
For those unfamiliar, liquidation occurs when a trader is unable to meet the requirements to keep a position open, leading an exchange to forcefully close the contract. This could be due to insufficient margin balance or a wrong prediction accompanied by high leverage of volatility.
At press time, BTC’s price was $69,085 while ETH changed hands at $3,803. A few weeks back, the values of these cryptocurrencies were not near this point. But will Bitcoin and Ethereum continue to produce green candlesticks? This price analysis gives some insights.
Bitcoin (BTC)
From a technical perspective, the BTC/USD chart showed that the Moving Average Convergence Divergence (MACD) was at a critical point. Although the reading was positive, the 12 EMA (blue) and 26 EMA (orange) were around the same spot.
This position indicates that bulls and bears were struggling for dominance. If the shorter EMA rises above the longer one, Bitcoin might rise to $71,054 where the 1.618 golden ratio was positioned.
However, BTC might drop to other Fibonacci levels if the 26 EMA crosses above the 12 EMA. If this is the case, the price of the coin might slip to $65,986 (the 0.618 Fib level).
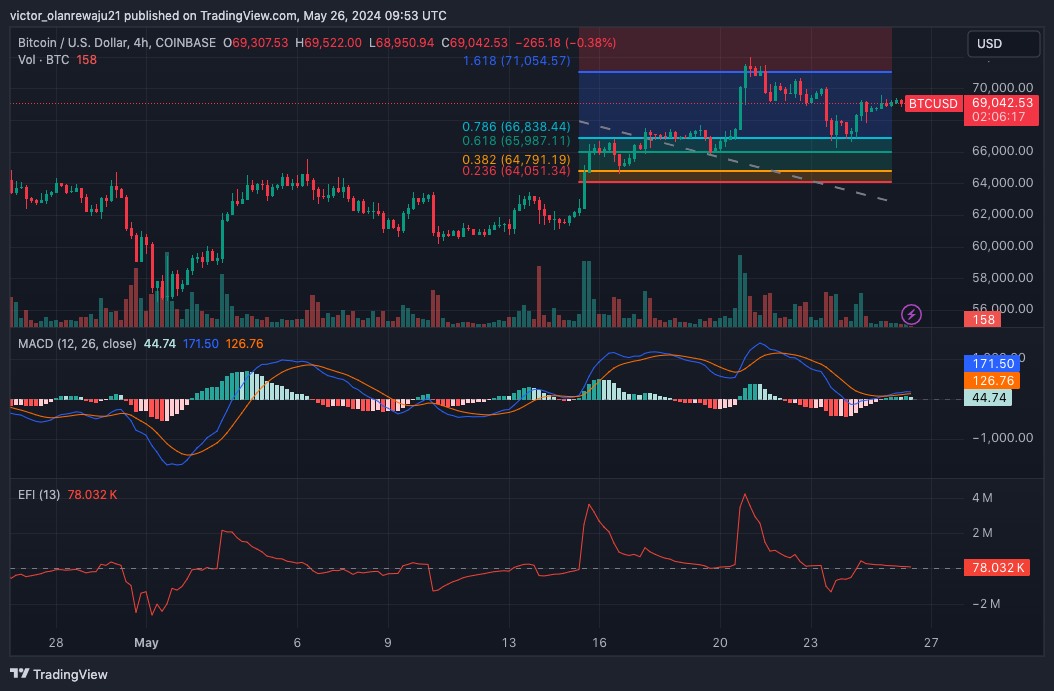
In addition, Coin Edition looked at the Elder Force Index (EFI). At press time, the EFI flatlined, indicating a lack of intense buying or selling pressure. As such, Bitcoin might swing sideways for a while before it goes on a steep correlation or large increase.
Ethereum (ETH)
During the week, two major bullish candles drove ETH to $3,940. However, the price has fallen from that peak. Furthermore, the Relative Strength Index (RSI) showed that ETH was previously overbought.
But the reading had decreased at press time, suggesting that bulls were no longer as dominant as before.
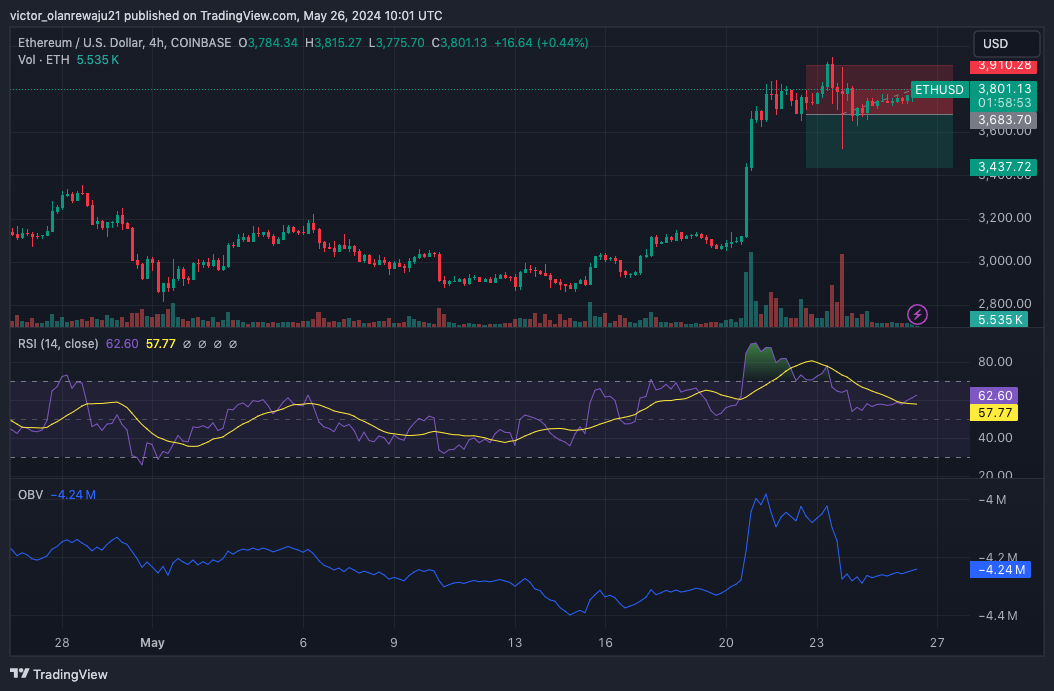
Like the RSI, the On Balance Volume (OBV) reading also decreases, reinforcing that notion of a decrease in buying pressure. By the look of things, ETH could set to drop to $3,437. However, invalidation of this bearish thesis could send the altcoin to $4,000.
Disclaimer: The information presented in this article is for informational and educational purposes only. The article does not constitute financial advice or advice of any kind. Coin Edition is not responsible for any losses incurred as a result of the utilization of content, products, or services mentioned. Readers are advised to exercise caution before taking any action related to the company.
: What Happens If You Use an Unlicensed Platform?")


