


- RUNE tapped a three-month high, thanks to its 46% increase in the last seven days.
- Unless demand for RUNE increases, the token could correct to $0.85.
- The CVD and CMF aligned with a large buying presence, indicating that RUNE could head for $1.50.
Over the last week, the majority of altcoins failed to produce any significant move. But ThorChain (RUNE) managed to stand out, producing a staggering 46.71% hike in the last seven days. RUNE’s increase also ensured that it outperformed memecoins including Dogecoin (DOGE) and Shiba Inu (SHIB), which have had a recent profitable period.
Although RUNE’s rise made it the top gainer out of the top 100 assets, it also represents a three-month high since it last reached the price in May.
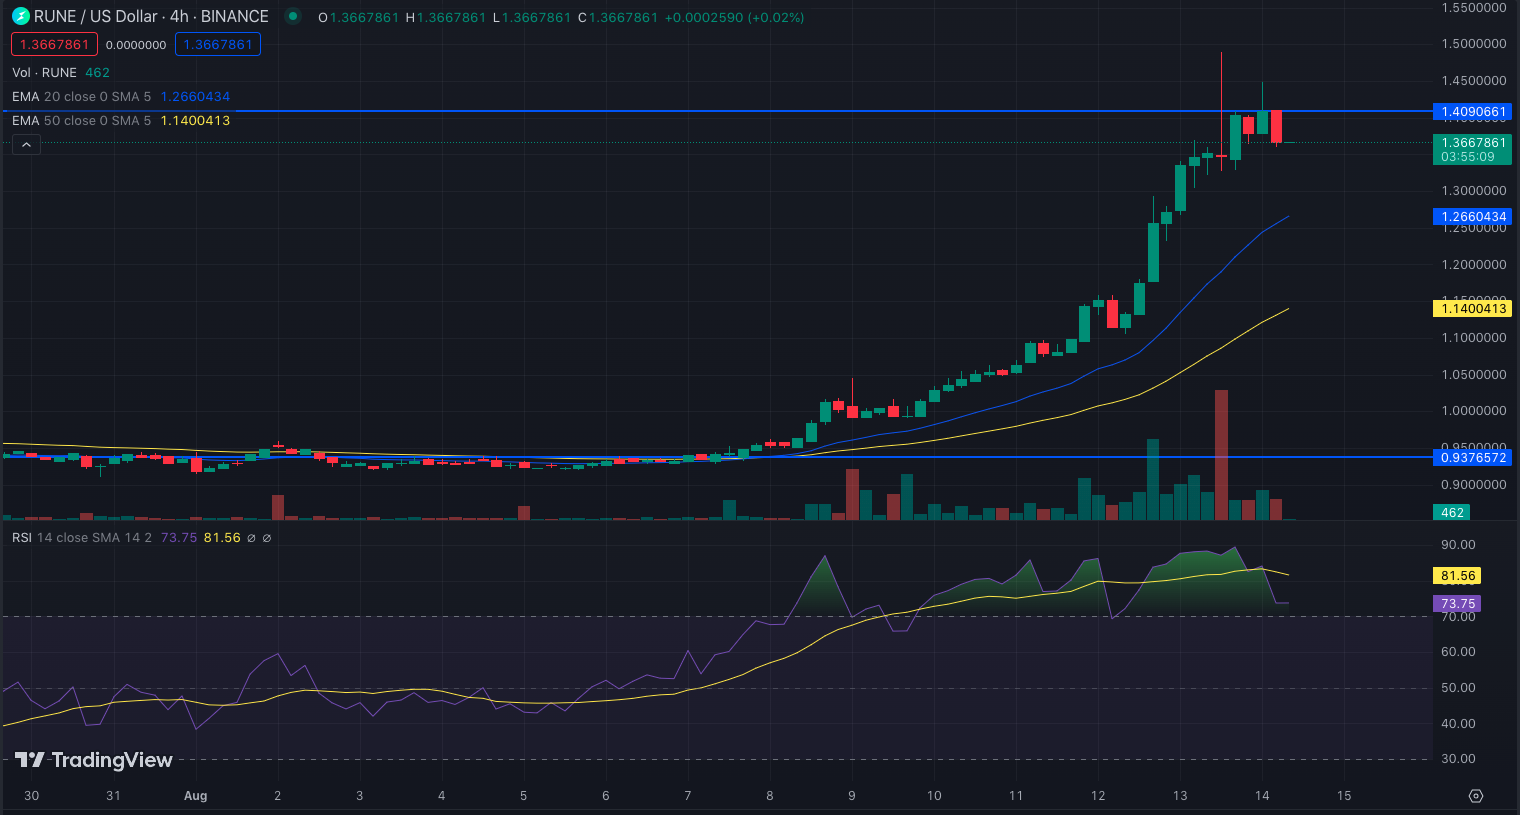
The tremendous rally has raised questions about whether ThorChain’s native token could remain a focal point of interest going forward. According to the RUNE/USD 4-hour chart, the token scaled past multiple resistance turned them into support, and finally formed a bullish market structure.
Correction on the Horizon
After reaching a peak of $1.41, RUNE retraced to $1.36 — a sign that market participants had taken some profits. However, the pullback may not be severe enough to dismantle the bullish order block, the Exponential Moving Average (EMA) indicated.
At press time, the 20 EMA (blue) had crossed over the 50 EMA (yellow). The crossover could be linked to the demand created at $0.93 on August 7. So, the broader sentiment for RUNE remained bullish.
Considering the Relative Strength Index (RSI), it had moved north and rose as high as 73.14. The RSI value means that RUNE was overbought. So, it is likely that RUNE potentially heads south if buying pressure fails to override profit-taking. If demand shrinks, then RUNE’s correction may be as low as $0.85.
Money Keeps Flowing into RUNE
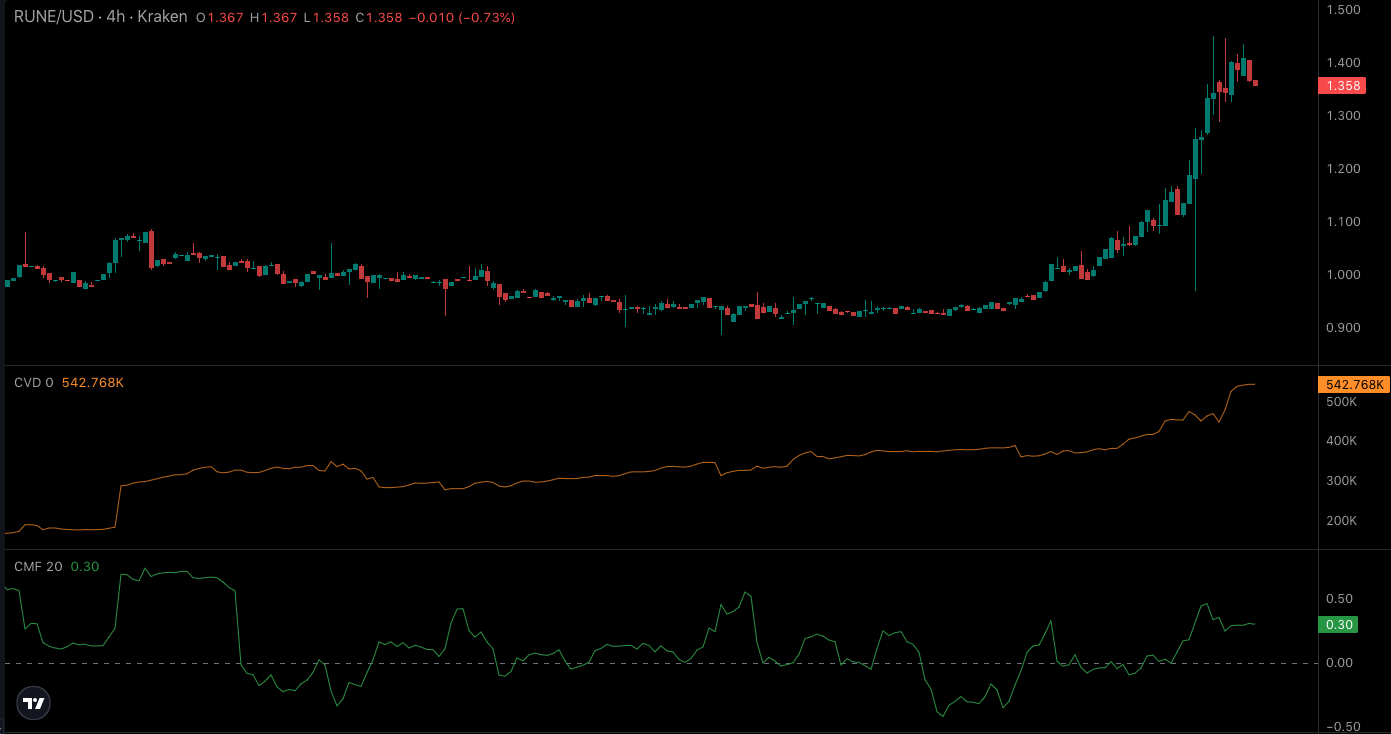
Additionally, the Cumulative Volume Delta (CVD) supported a bullish bias. At press time, the CVD had risen to 542,787. As an indicator to measure an asset’s mid to long-term buy and sell pressure, the CVD offers insight into the market behavior.
If the CVD trend downwards, it means that there are more aggressive sellers. But RUNE’s CVD hike implies that the presence of buyers was much more than that of sellers. Furthermore, the Chaikin Money Flow (CMF) was 0.30.
Using a combination of recent price movement and volume, the CMF monitors distribution and accumulation. Therefore, the CMF hike aligns with the CVD notion that there has been increased buying pressure.
If the buying pressure continues to increase, then RUNE might rise as high as $1.50. But the downtrend with the RSI needs to change to confirm this breakout.
Disclaimer: The views, opinions, and information shared in this price prediction are published in good faith. Readers must do their research and due diligence. Any action taken by the reader is strictly at their own risk. Coin Edition and its affiliates will not be liable for direct or indirect damage or loss.
Disclaimer: The information presented in this article is for informational and educational purposes only. The article does not constitute financial advice or advice of any kind. Coin Edition is not responsible for any losses incurred as a result of the utilization of content, products, or services mentioned. Readers are advised to exercise caution before taking any action related to the company.


