


 Token Unlock Send the Price Down?")
- The Sandbox changed $1.3 million SAND to USDC, with more sales expected.
- SAND’s price fell to $0.442 but another decline to below 0.40 could be possible.
- The MACD and RSI reflected bearish momentum, indicating a likely slide to $0.36.
According to Spot On Chain, four wallets linked to The Sandbox (SAND) team have deposited $41.21 million worth of the token to Binance. The on-chain tracking platform, in its post, noted that the tokens came from the project’s multi-sig wallet.
Out of the tokens sent, $1.3 million SAND has been exchanged for USDC, Coin Edition confirmed. Meanwhile, The Sandbox has scheduled February 14 as the day to unlock more SAND tokens into circulation. At press time price the 205.59 million tokens were worth $90.2 million.
SAND to Face More Selling Pressure
With the upcoming unlock, SAND might face another round of selling pressure considering that the supply might outweigh demand.
However, the recent sale of the tokens has affected its price. According to CoinMarketCap, the price of SAND hit a ceiling of $0.447 on February 2. But a few hours after the sale, the value dropped and was trading at $0.442 at press time.
On a Year-To-Date (YTD) basis, SAND’s price has decreased by 28.88%, indicating that there have been more sell-offs than buys since January 1. Based on the 4-hour chart, SAND’s decline seemed to have been affected by buyer exhaustion.
For instance, the price jumped from $0.29 to $0.62 between October 15, 2023, and December 28 of the same year. But a sharp plunge to $0.45 on January 2 implied that participants were taking profits and SAND lacked demand to mitigate the effect.
No Bull to Defend the Price
At press time, SAND had lost hold of $0.45. If the pressure from bears intensifies, SAND might drop to $0.40. If bulls can’t defend that region, then the next point SAND might hit would be around $0.36.
A look at the Relative Strength Index (RSI) that the momentum had become weak. As of this writing, the RSI was 40.59, with signals indicating a possible drop below the reading. Should the RSI drop below 40.00, SAND’s first target might be $0.40.
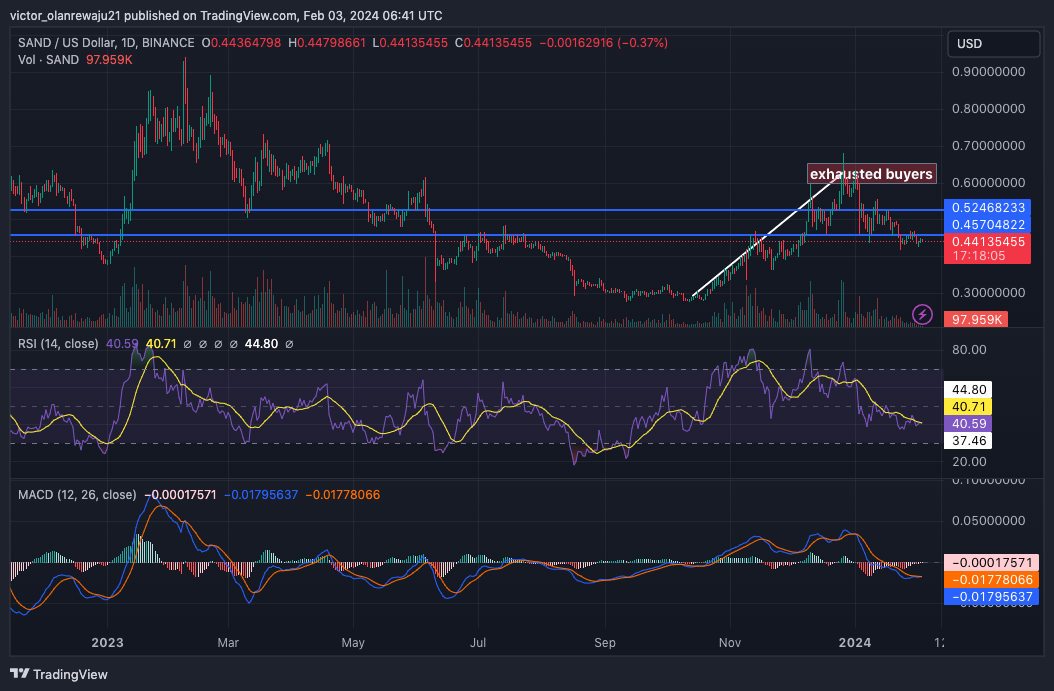
Furthermore, indications from the Moving Average Convergence Divergence (MACD) confirmed that the token’s momentum was bearish. This was not only because the MACD reading was negative but because the 26 EMA (orange) was above the 12 EMA (blue), suggesting sellers’ dominance.
As it stands, SAND’s price might fall as low as $0.36 in the short term. But if it does, it could offer a good entry for buyers before altcoins start to rally again.
Disclaimer: The information presented in this article is for informational and educational purposes only. The article does not constitute financial advice or advice of any kind. Coin Edition is not responsible for any losses incurred as a result of the utilization of content, products, or services mentioned. Readers are advised to exercise caution before taking any action related to the company.


