






- XRP trades near $1.548 as the $1.486 golden zone becomes the key rebound level.
- A golden cross forms with the faster average at $1.4859 above the slower $1.4137 line.
- Week 4 liquidity near $1.62 must break before the $1.6977 Q3 high comes into focus.
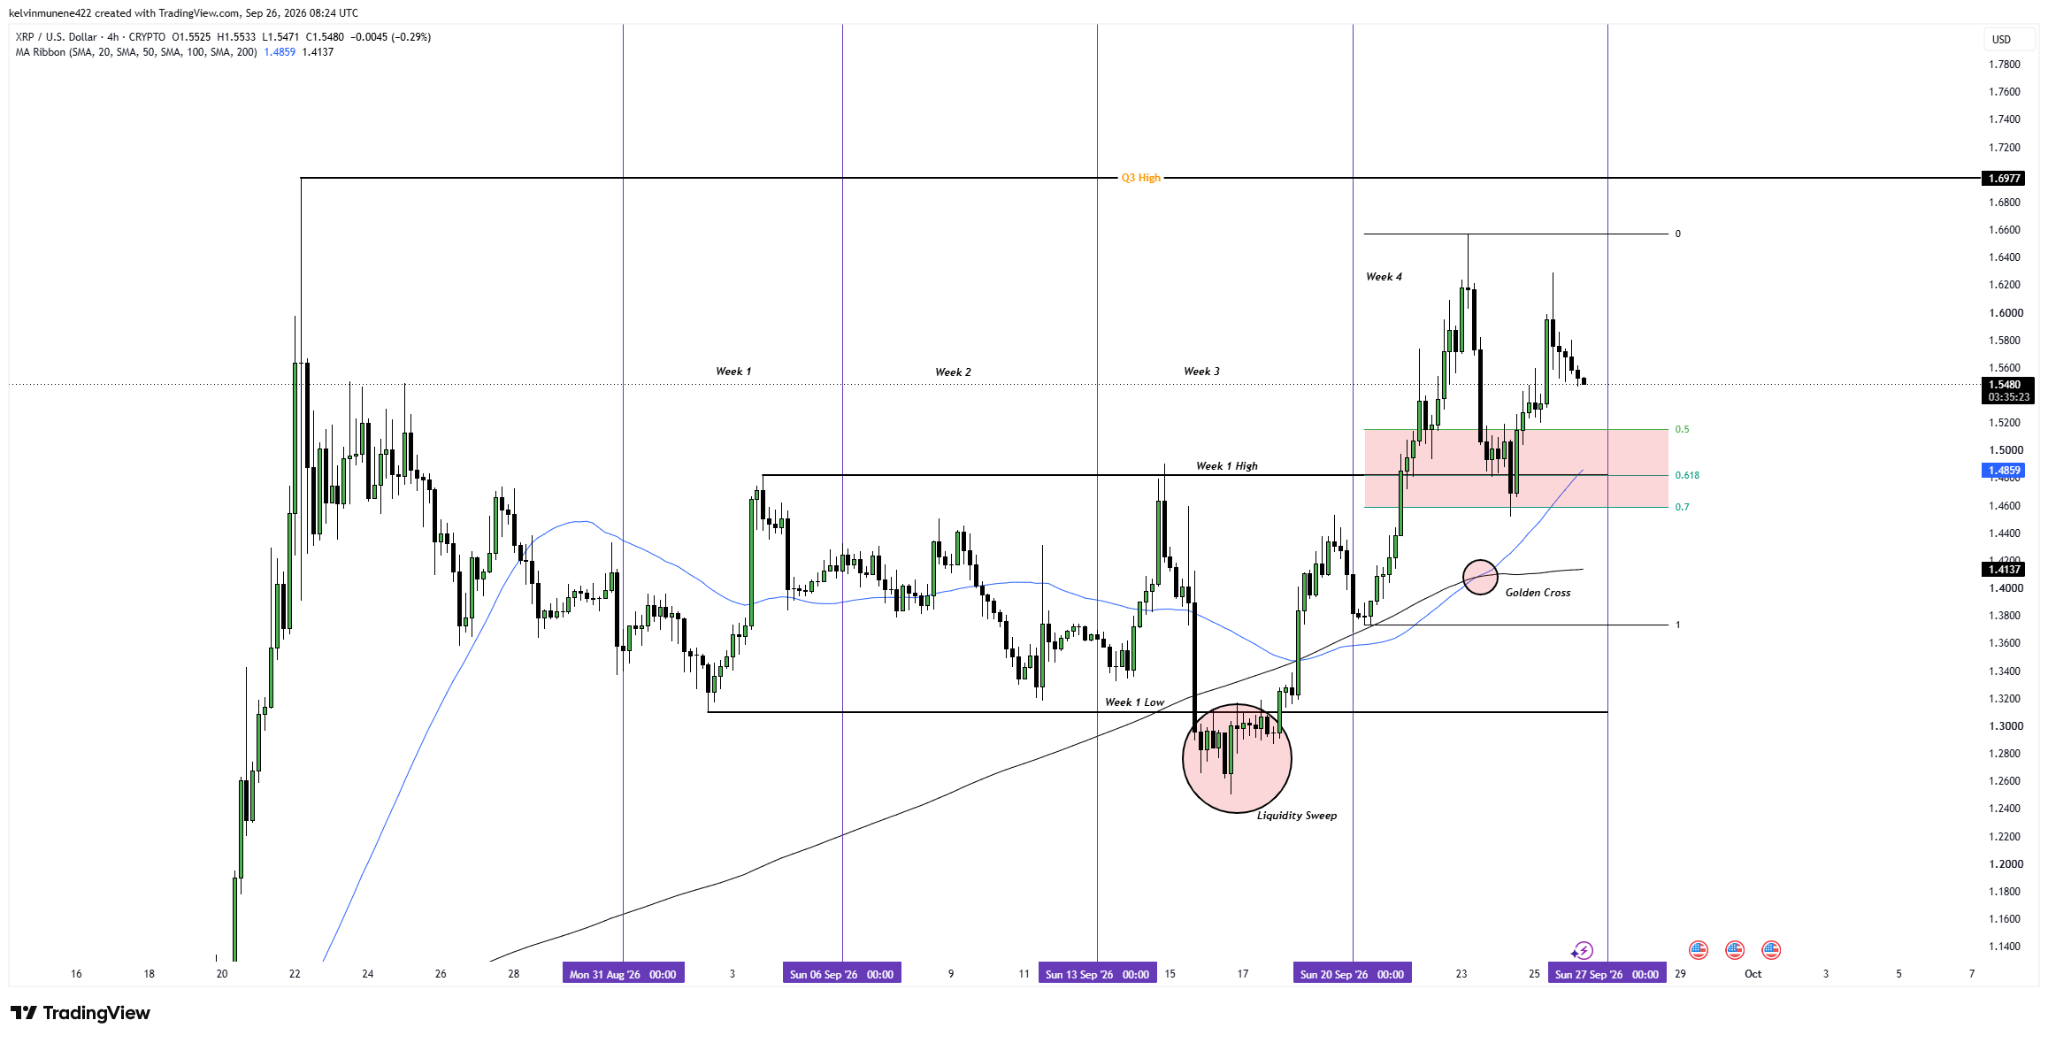
XRP’s latest pullback is testing the same area that supported the Week 3 breakout, keeping the weekly structure constructive. The token’s price trades near $1.548 after retreating from the Week 4 high around $1.62.
The key confirmation zone now sits near the 0.618 Fibonacci retracement at $1.486. A bullish reaction there would show buyers defending the prior breakout and increase the chance that late sellers are caught in a failed downside move.
In turn, that response would preserve the broader weekly structure, which remains defined by a liquidity sweep, recovery, retracement, and possible continuation toward external liquidity above the Week 4 high.
Seller Trap Setup Builds as Golden Cross Supports $1.486
The broader sequence began when price swept sell-side liquidity around $1.26 to $1.31 before reversing higher. That recovery reclaimed the former Week 1 high near $1.486 and extended toward the Week 4 high around $1.62.
However, the current decline has returned XRP’s price toward the same breakout area. The chart places the 0.618 Fibonacci retracement near $1.486 and the 0.70 level near $1.46. Together, those levels create a $1.46 to $1.49 support zone.
Source: TradingView
Holding that region would preserve the recovery structure. Nonetheless, if sellers press lower but the price rejects the golden zone, bearish continuation would fail. That failure would leave short-term sellers positioned against renewed upside.
| Technical Level | Role in the Setup |
| $1.548 | Current chart price |
| $1.486 | 0.618 retracement and former Week 1 high |
| $1.46 | 0.70 retracement and deeper support |
| $1.62 | Week 4 high and first external liquidity target |
| $1.6977 | Q3 high and next major upside level |
Golden Cross Reinforces the Weekly Rebound Structure
The moving averages add another technical layer to the same support region. The 50-week MA sits near $1.4859, while the 200-week MA remains around $1.4137. Notably, the faster average has crossed above the slower line, forming a golden cross.
Price also remains above both averages, reinforcing the broader continuation structure. Moreover, the signal carries additional weight, as the 50-week MA sits almost directly on the $1.486 Fibonacci retracement. As a result, that area now combines Fibonacci support with a key long-term moving average.
Meanwhile, derivatives activity shows notable participation around the same price range. CME reported an estimated futures volume of 4,944 contracts on September 23, while prior-day open interest totaled 8,684 contracts. September futures traded between $1.4815 and $1.6595, broadly overlapping the technical range shown on the chart.
Week 4 Liquidity Opens the Path Toward $1.70
The next confirmation would come from a bullish reaction near $1.486 followed by a move back toward $1.62. That sequence would show that the retracement failed to produce a deeper breakdown and redirect attention toward external liquidity above the Week 4 high.
A confirmed break above $1.62 would expose the Q3 high at $1.6977. Clearing that level would place $1.70 directly in focus.
| Scenario | Technical Trigger | Next Level |
| Bullish continuation | Hold $1.46-$1.49 and rebound | $1.62 |
| Breakout extension | Clear the Week 4 high. | $1.6977 |
| Failure case | Sustain below $1.46. | $1.414 area |
Bottom Line
The weekly structure remains constructive while the $1.46 to $1.49 zone holds. A bullish reaction from $1.486 would strengthen the seller-trap thesis and support the golden-cross signal. In such a scenario, the first upside test remains the Week 4 high near $1.62. A confirmed break would further expose $1.6977 and bring $1.70 into focus.
FAQs
The main support area sits between $1.46 and $1.49, with the 0.618 Fibonacci level near $1.486 providing confirmation.
A rejection from the golden zone followed by a renewed move toward $1.62 would show that the retracement failed to extend lower.
The Week 4 high around $1.62 is the first target. A confirmed break would expose the $1.6977 Q3 high.
Sustained acceptance below roughly $1.46 would weaken the continuation structure and bring the slower-moving average near $1.414 into focus.
Related: Bitcoin Price LIVE: Bullish Weekly Close Could Open a Path Toward $100K
Disclaimer: The information presented in this article is for informational and educational purposes only. The article does not constitute financial advice or advice of any kind. Coin Edition is not responsible for any losses incurred as a result of the utilization of content, products, or services mentioned. Readers are advised to exercise caution before taking any action related to the company.




