
- XRP price prediction stays fragile below $1.45, needs a reclaim of that zone to undo last week’s rejection from $1.70
- This week’s ETF inflows hit $37.69M in just two trading days, already nearly matching last week’s full $39.78M total
- Longs took $16.23M of Wednesday’s $17.50M in liquidations, the exact opposite of the squeeze that drove XRP to $1.70 a week ago
XRP is down 7% this week after opening near $1.52. That pullback comes on the heels of last week’s 51% surge to $1.70, so XRP is still holding most of that move, not erasing it.
XRP Price Analysis: Did XRP’s Rejection at $1.70 Just Reset the Whole Move?
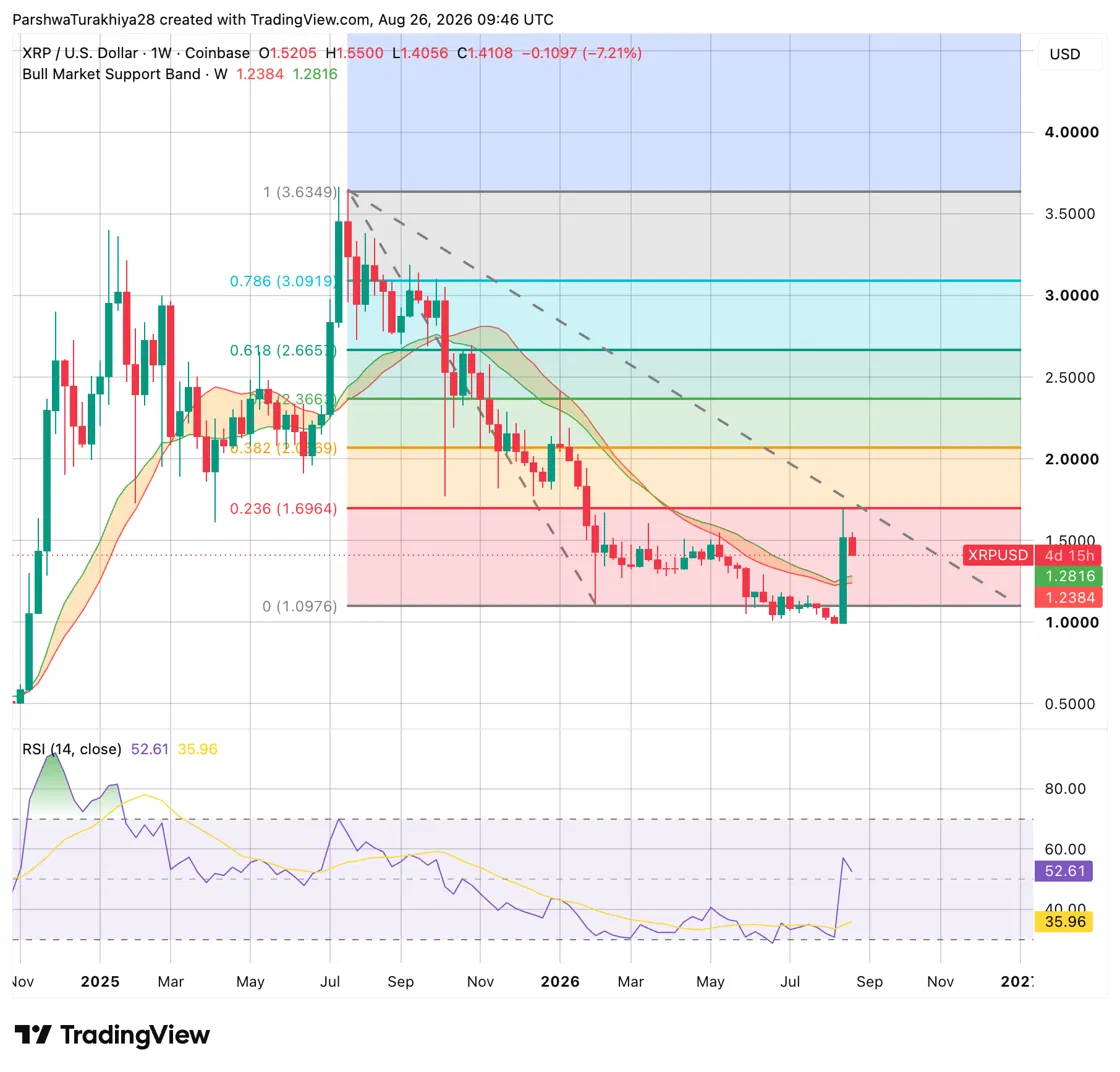
The weekly chart shows XRP spiked into the 0.236 Fibonacci retracement at $1.6964, tagged $1.70, then fell straight back through it. Price is now trading at $1.4108 on the weekly close, sitting in the same zone it broke out from before the spike, a full round trip in seven days.
Weekly RSI is the one thing arguing against a deeper unwind. It jumped to 52.61 this week from levels stuck near 35-40 for most of the year, the first real momentum shift on the weekly timeframe since XRP’s decline began, and it’s holding above 50 even with this week’s rejection factored in. The Bull Market Support Band, built from the 20-week EMA and 50-week SMA, sits well below current price at $1.2384 to $1.2816 and hasn’t been tested at all.
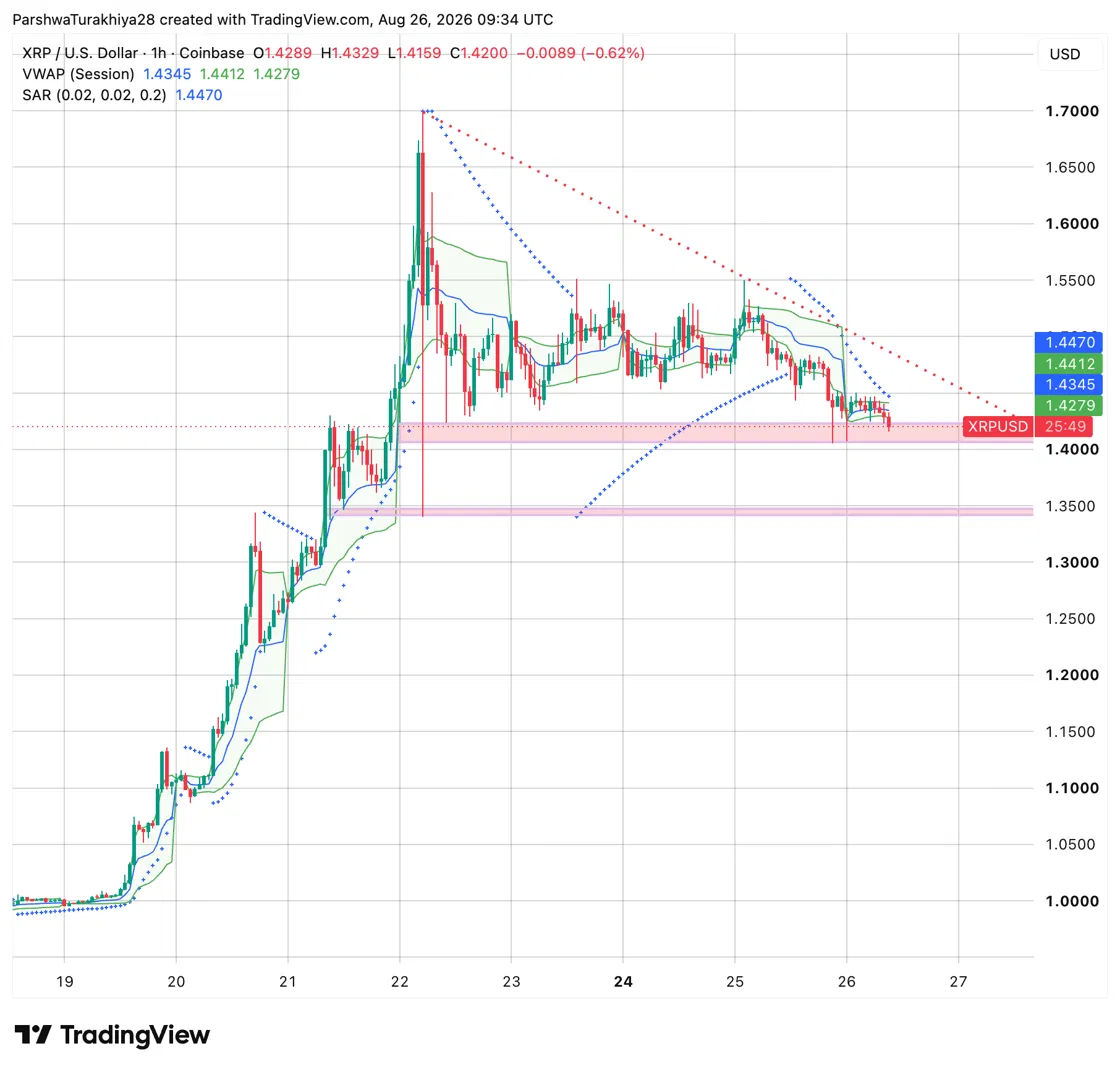
Meanwhile, the hourly chart shows how this played out intraday. Price broke below the session VWAP bands, currently at $1.4279 to $1.4412, and is trading beneath all three VWAP lines at $1.42.
Related: Ethereum (ETH) Price Prediction: ETH Bulls Target $2,600 After Fresh 30,000 ETH Buying
Moreover, the Parabolic SAR on this timeframe sits at $1.4470, above price, keeping the short-term signal bearish. What stands out is the horizontal zone near $1.40 to $1.42, the same range that acted as resistance right before last week’s breakout to $1.70. XRP is now sitting almost exactly on that level, testing whether old resistance holds as new support.
XRP Support and Resistance Levels, August 26, 2026
| Type | Price | Level |
| Resistance | $1.4470 | Parabolic SAR (1h) |
| Resistance | $1.6964 | 0.236 Fibonacci, last week’s breakout level |
| Resistance | $1.70 | Weekly high |
| Support | $1.40 to $1.42 | Prior breakout base, now being retested |
| Support | $1.2816 | Bull Market Support Band, upper bound |
| Support | $1.2384 | Bull Market Support Band, lower bound |
XRP News: Two Days of ETF Inflows Already Match Last Week’s Total
XRP ETFs pulled in $37.69M across just two trading days this week, nearly matching the $39.78M that came in across all five days last week according to SoSoValue. Tuesday alone brought in $23.87M, the strongest single day since May 11, 2026, led by Bitwise’s XRP fund with $11.02M.
Cumulative net inflow across all XRP ETFs now sits at $1.59B, with total net assets at $1.46B. Spot exchange data shows a smaller version of the same pattern: $4.88M in net inflow on August 26, a modest positive reading against a year of mostly outflows on that same chart.
XRP Derivatives: This Week’s Losses Are Landing on the Same Traders Who Won Last Week
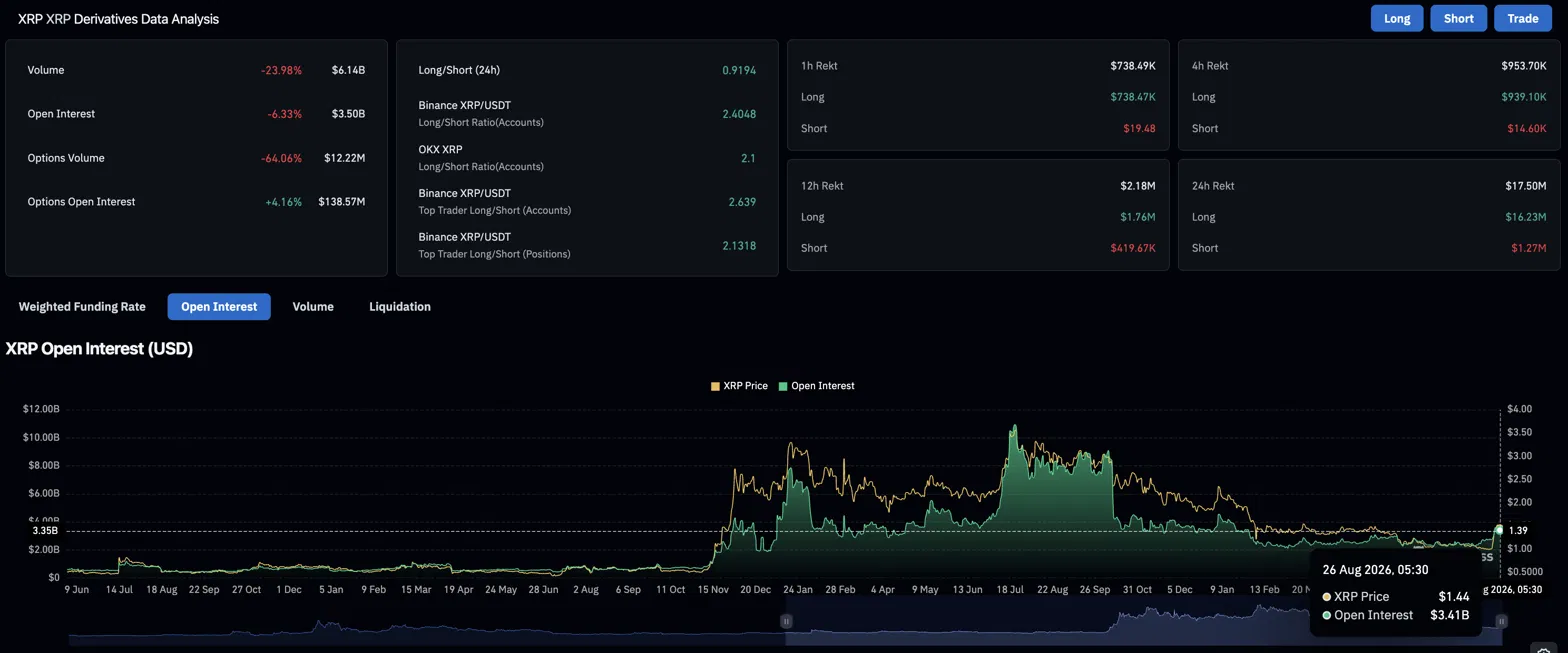
XRP’s derivatives volume fell 23.98% to $6.14B over the past 24 hours, while open interest, the total value of open leveraged bets, dropped 6.33% to $3.50B. Both falling together usually means traders are closing positions, not adding new ones.
The liquidation data shows who’s paying for this week’s drop. Of the $17.50M wiped out in the past 24 hours, $16.23M came from longs, traders betting on more upside who got caught as price fell. A week ago, it was the opposite: short sellers got squeezed and helped push XRP to $1.70. Now the same group that profited then is eating the reversal. Binance’s long/short ratio is still 2.40, meaning most of last week’s long positioning hasn’t unwound yet, so more of this liquidation could still be ahead.
| Metric | Value | What it shows |
| Derivatives volume (24h) | $6.14B, down 23.98% | Trading activity cooling off |
| Open interest | $3.50B, down 6.33% | Positions shrinking as price falls |
| Long liquidations (24h) | $16.23M of $17.50M total | Longs took nearly all of this week’s losses |
| Binance long/short ratio | 2.4048 | Traders still net long despite the losses |
Related: Bitcoin Price Prediction: Is IBIT’s Dominance a Warning Sign for BTC’s Rally?
Our Take: Watch the Binance Ratio, Not the Price
ETF inflows this week are running at double last week’s daily pace, and last week was the 51% rally. Institutions bought faster into the drop than into the surge, that’s normal for ETF flows, which average into weakness rather than chase strength.
The problem is Binance’s long/short ratio is still 2.40, barely moved despite $16.23M in long liquidations today. Derivatives unwind in hours; ETF positioning shifts over days, they’re not the same clock. If that ratio hasn’t dropped toward 1.5 by Friday, more long liquidations are coming regardless of what ETFs do that day.
As we like to put it: “price tells you what happened but positioning tells you what’s still coming.”
FAQ: XRP Price Prediction
XRP trades at $1.41 after round-tripping back to the zone it broke out from last week. Price needs to reclaim $1.45 to undo last week’s rejection from $1.70, with the $1.40 to $1.42 zone currently being retested as support.
XRP spiked into the 0.236 Fibonacci retracement at $1.6964 last week, tagged $1.70, and fell straight back through it, giving back the entire move within seven days. The pullback still holds above the zone XRP broke out from rather than falling further, which keeps the move from reading as a full reversal.
Yes. XRP ETFs pulled in $37.69 million across just two trading days this week, nearly matching last week’s entire five-day total of $39.78 million, with Tuesday’s $23.87 million the strongest single day since May 11.
Binance’s long/short ratio, still at 2.40 despite today’s liquidations, is the level to watch. It would need to drop toward 1.5 to signal overextended long positioning has meaningfully unwound; until then, more forced long liquidations remain a real possibility regardless of ETF flows.
XRP is showing a genuine split between strong institutional ETF demand and leveraged long positions still unwinding, two signals moving on different timelines rather than agreeing with each other. This is not financial advice, so weigh both sides of that split against your own research and risk tolerance.
Related: Cardano Price Prediction: Is ADA’s Pullback From $0.26 a Reset or a Warning Sign?
Disclaimer: The information presented in this article is for informational and educational purposes only. The article does not constitute financial advice or advice of any kind. Coin Edition is not responsible for any losses incurred as a result of the utilization of content, products, or services mentioned. Readers are advised to exercise caution before taking any action related to the company.