


- XRP faces growing short-term bearish pressure, trading below all major EMAs near $1.38.
- Declining open interest signals reduced speculative activity and calmer market conditions.
- Exchange outflows persist but moderate, suggesting selling pressure may slowly ease.
XRP continued to trade under pressure this week after losing momentum near the crucial $1.50 resistance area. The asset has slipped toward the $1.38 region, reflecting growing caution across the broader crypto market. Although long-term sentiment has not completely turned bearish, short-term indicators now favor sellers after several failed recovery attempts.
Bearish Momentum Intensifies Below Major EMAs
The recent rejection near the 0.786 Fibonacci retracement level around $1.505 weakened bullish confidence significantly. Consequently, XRP now trades beneath its 20, 50, and 100 exponential moving averages on the four-hour chart. This structure often signals fading momentum and increasing downside pressure.
Moreover, the 200 EMA near $1.414 has become a critical technical battleground. Bulls must reclaim this zone to restore near-term strength. Otherwise, sellers may continue controlling short-term price action.
Technical indicators also highlight rising uncertainty. The Bollinger Band %B indicator currently sits near 0.10, placing XRP close to the lower volatility band. While this setup can sometimes precede rebounds, buyers still lack enough momentum to confirm a recovery.
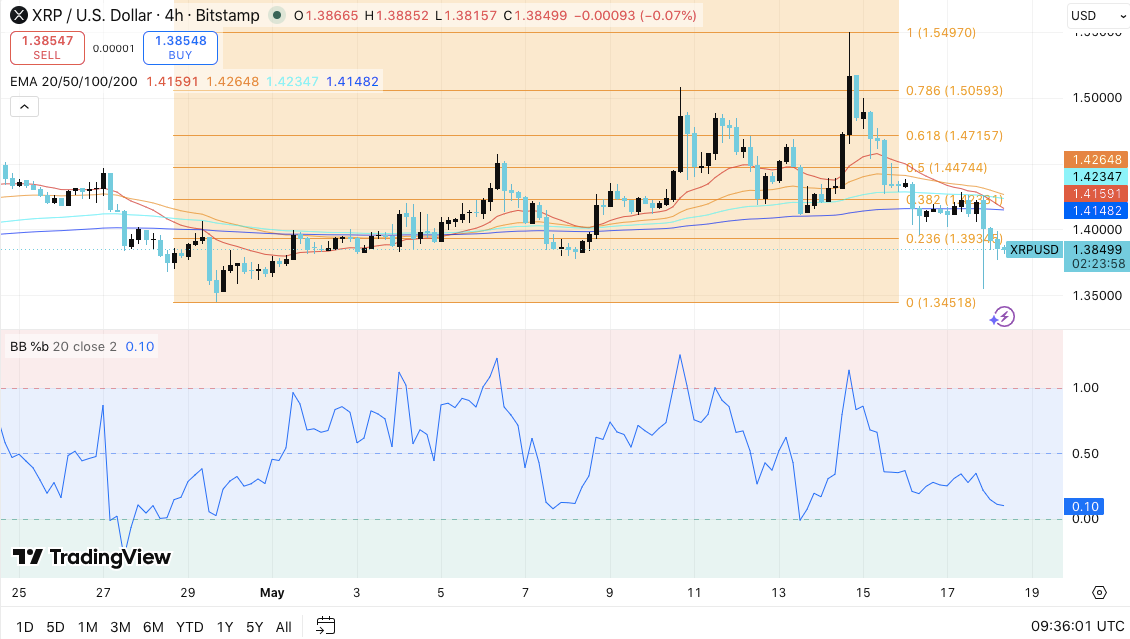
Immediate support remains near the $1.393 and $1.394 region, which aligns with the Fibonacci 0.236 retracement zone. If XRP loses this area, the market could quickly revisit the major floor around $1.345. A breakdown below that level may expose the asset to deeper losses toward $1.30.
Related: Ethereum Price Prediction: ETH Faces Heavy Selling Pressure After $11.5 Million Verus Bridge Exploit
On the upside, resistance stands between $1.412 and $1.424, where multiple moving averages continue limiting recovery attempts. Beyond that, traders will watch the $1.447 level closely before focusing again on the stronger resistance band between $1.471 and $1.505.
Open Interest Decline Signals Cooling Speculation
Derivatives data also reflects a major shift in trader behavior. XRP open interest previously surged above $10 billion during the late-2025 rally, fueled by aggressive leveraged positions and heightened market enthusiasm.
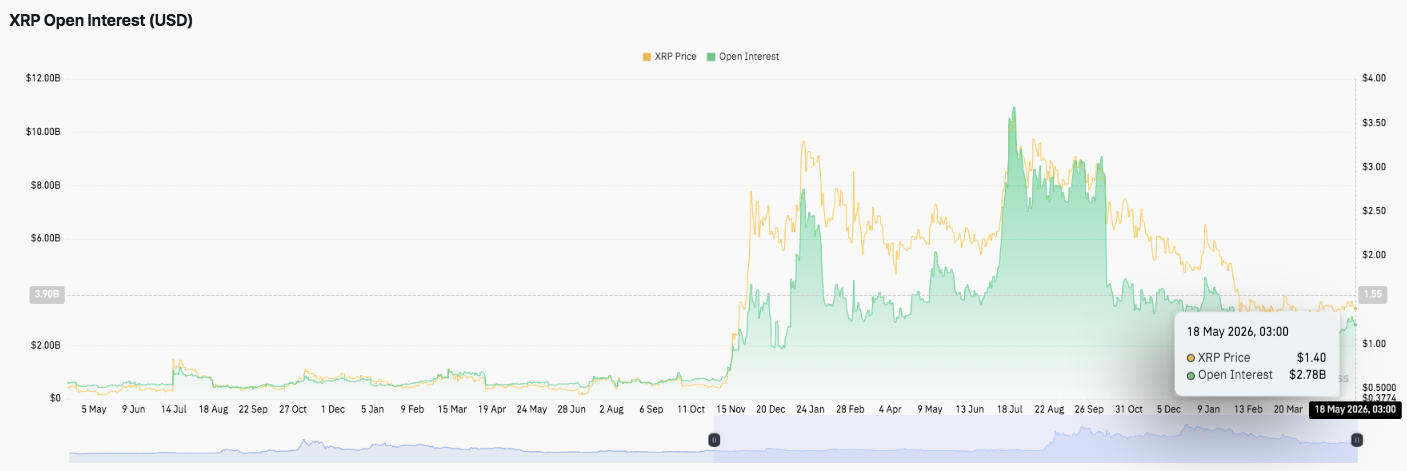
However, repeated corrections triggered large liquidation events across the market. Hence, open interest steadily declined and recently stabilized near $2.78 billion while XRP traded around $1.40.
This stabilization suggests speculative activity has cooled considerably. Additionally, the current environment appears healthier after months of excessive leverage and extreme volatility.
Exchange Outflows Continue Despite Weak Price Action
Spot market data presents a slightly different move. Exchange outflows consistently exceeded inflows during recent months, indicating many investors continued accumulating XRP despite declining prices.
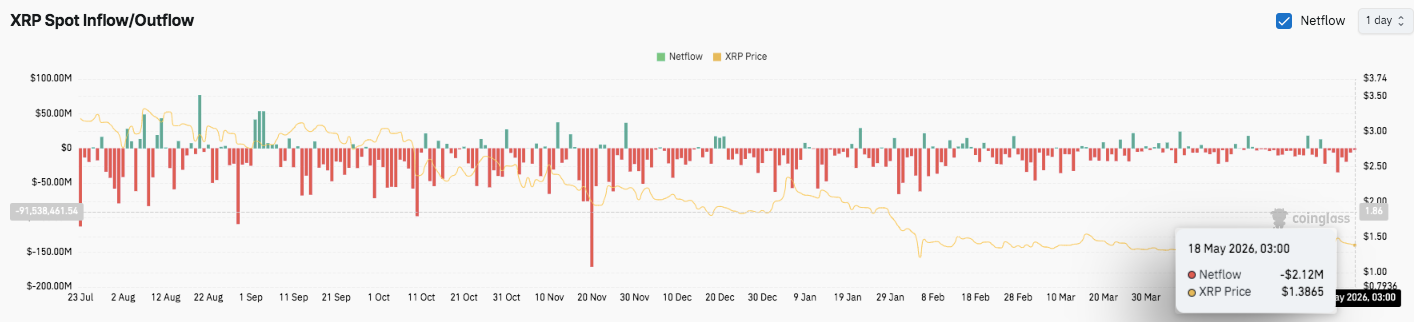
Several outflow spikes surpassed $100 million between November and February, showing sustained withdrawal activity from exchanges. Although inflows occasionally increased, they failed to reverse the broader negative netflow trend.
Related: Bitcoin Price Prediction: Bond Yields Hit 2008 Levels As BTC Drops Back Below $78,000
Recently, however, outflow volumes have moderated. This shift may indicate that selling pressure is gradually easing near current levels. Even so, broader market uncertainty continues limiting bullish conviction in the short term.
Technical Outlook For XRP Price
Key XRP levels remain critical as price consolidates near the $1.40 region following a failed breakout above major Fibonacci resistance.
Upside levels: $1.412–$1.424 remains the first resistance cluster, followed by $1.447 at the Fibonacci 0.5 level. A stronger breakout could open the path toward $1.471 and eventually $1.505, where sellers recently regained control.
Downside levels: Immediate support sits around $1.393–$1.394, which continues to act as a short-term demand zone. Below that, $1.345 remains the major structural floor. Failure to hold this region could expose XRP to a deeper decline toward $1.30.
Resistance ceiling: The $1.47–$1.50 region remains the key breakout barrier for restoring medium-term bullish momentum. XRP must reclaim this zone to invalidate the current bearish correction structure.
The broader technical picture shows XRP trading beneath the 20, 50, and 100 EMAs, while the 200 EMA near $1.414 acts as an important pivot level. Moreover, Bollinger Band compression signals growing volatility pressure after several sessions of tight consolidation.
Will XRP Recover?
XRP price prediction now depends heavily on whether buyers can defend the $1.39 support region and reclaim the EMA resistance cluster. Stabilizing open interest near $2.78 billion suggests speculative pressure has cooled, which may help reduce extreme volatility in the short term.
Besides, persistent exchange outflows continue to indicate underlying accumulation despite weakening momentum. If bullish momentum returns alongside stronger spot demand, XRP could recover toward $1.44 and potentially retest the $1.47–$1.50 resistance zone.
Related: Zcash Price Prediction: Can ZEC Reclaim $600 as Open Interest Rebounds?
However, failure to hold $1.39 may strengthen bearish momentum and accelerate downside pressure toward $1.345 and possibly $1.30. For now, XRP remains trapped inside a fragile consolidation range, where technical confirmation will likely determine the next major directional move.
Disclaimer: The information presented in this article is for informational and educational purposes only. The article does not constitute financial advice or advice of any kind. Coin Edition is not responsible for any losses incurred as a result of the utilization of content, products, or services mentioned. Readers are advised to exercise caution before taking any action related to the company.
 Price Prediction 2026-2030: Will TRX Hit $0.50 Soon?")
 Price Prediction 2026-2050: Will HYPE Hit $100 Soon?")


: What Happens If You Use an Unlicensed Platform?")