






- Bitcoin’s Local Market Stress Index rises to 16, its second spike in 3 days.
- Price Stress alone drives the reading; flow and leverage stress stay quiet.
- Exchange inflows hold near 60K BTC, about 76% of the annual average level.
Bitcoin’s Local Market Stress Index climbed to 16 in the latest reading, marking the second impulse in three days, according to CryptoQuant analyst Axel Adler Jr. The index remains driven almost entirely by price movement, with exchange flows and derivatives leverage showing no participation in the move.
In simple terms, the Stress Index is like a stress thermometer for Bitcoin. It runs from 0 to 100. The higher the number, the more nervous the market is getting. The current spike is roughly one-third the size of the July 28 reading, when the index reached 52 and entered the “Elevated” zone.
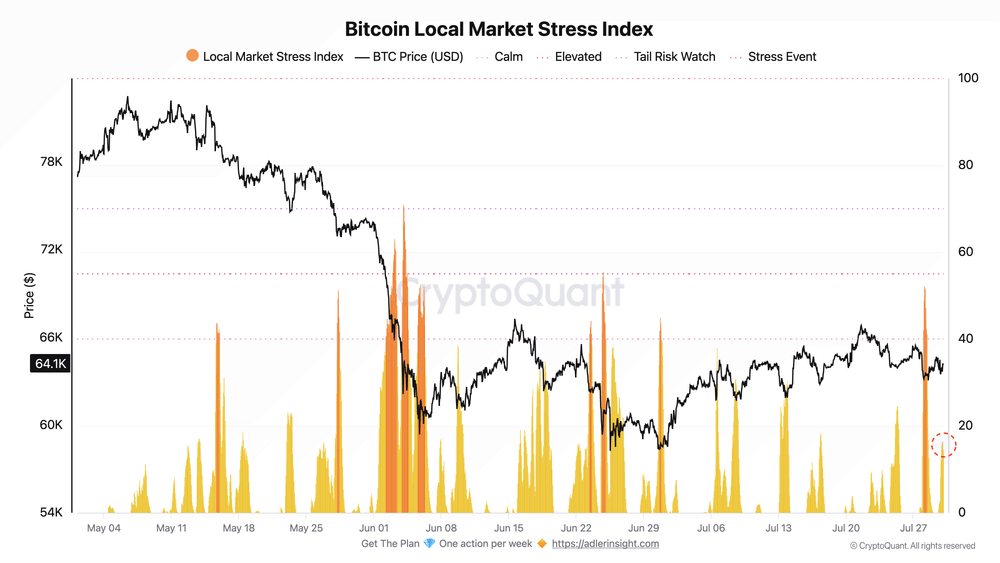
Adler said that the size of the index reading matters less than which components are producing it, since the mix of drivers determines whether an impulse stays contained or escalates further.
Price Stress Is the Sole Driver
The Local Market Stress Index breaks down into three components, each scored from 0 to 100:
- Price Stress
- Flow Stress
- Leverage Stress.
Price Stress is currently leading the reading, measuring how far recent price action deviates from the prior 90 days. A high reading in this component reflects elevated downside volatility, a local drawdown, and a persistent majority of negative trading hours occurring simultaneously.
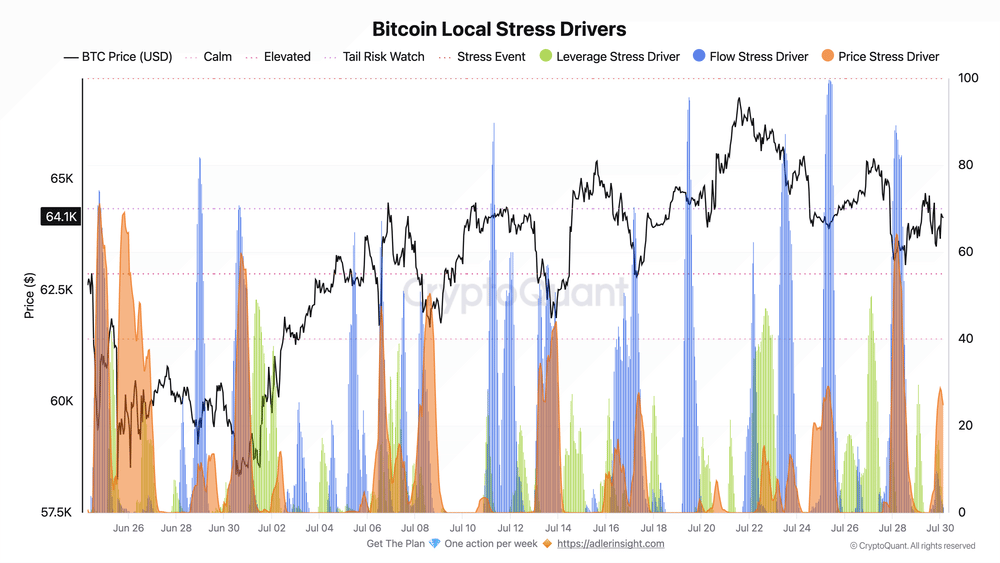
Adler pointed out that across all major stress spikes this cycle, the index has only pushed above 50 when exchange flows joined price-driven downside pressure. With no flow pressure currently present, the impulse has stalled well below that threshold.
Exchange Inflows Remain Historically Subdued
Supporting the muted flow reading, Bitcoin inflows to exchange addresses currently stand at around 60,000 BTC over a 30-day average, roughly 76% of the annual average near 79,000 BTC and close to the lowest level in the available data range. The historical low of 58,300 BTC was recorded in April 2026.
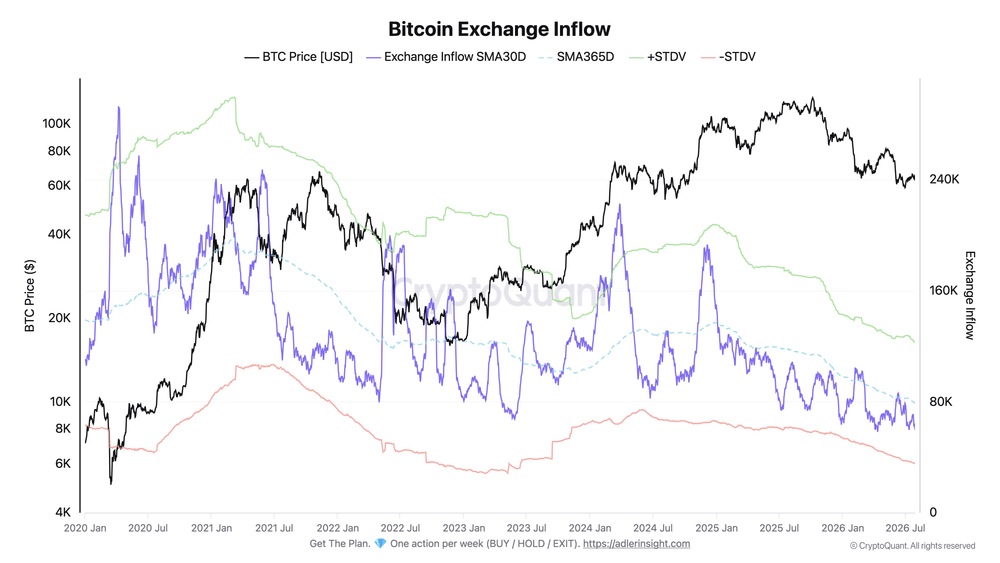
A year ago, inflows were closer to 100,000 BTC, meaning the volume of coins moving to exchanges has fallen by roughly a quarter over the past twelve months. The metric remains above the lower standard deviation band near 35,000 BTC, indicating a sustained decline in activity that has not yet reached statistically extreme territory.
Adler warned that low inflow readings do not determine market direction on their own, since inflows can be offset by outflows, and some transfers may reflect internal exchange activity rather than genuine selling pressure.
Related: Fed Holds Interest Rate Steady: What It Means for Bitcoin, Crypto, and Global Markets?
Disclaimer: The information presented in this article is for informational and educational purposes only. The article does not constitute financial advice or advice of any kind. Coin Edition is not responsible for any losses incurred as a result of the utilization of content, products, or services mentioned. Readers are advised to exercise caution before taking any action related to the company.




