


 Plummets Over 12% in Market Downturn, Eyes Rebound")
- Dogwifhat (WIF) dropped 12.42% amidst a broader market decline of 5.85%.
- WIF’s 218.18% 30-day surge contrasts with a recent 24-hour slump.
- Technical indicators hint at a potential WIF rebound from an oversold state.
The cryptocurrency dogwifhat (WIF) has seen a notable decline, falling 12.42% to a current price of $3.85. This dip starkly mirrors the broader crypto market’s 5.85% decrease, indicating underperformance, particularly against the backdrop of the market’s overall movement. The coin also fell by 8.31% against Bitcoin (BTC), highlighting its bearish momentum within the day.
Despite the day’s losses, dogwifhat has been on an upward trajectory over recent weeks and months. Per CoinMarketCap’s data, it recorded a substantial 200.07% increase in the last 30 days and a 2167.87% price surge over the past year. Dogwifhat achieved its all-time high of $4.80 on March 31, 2024, highlighting its significant growth potential and market interest.
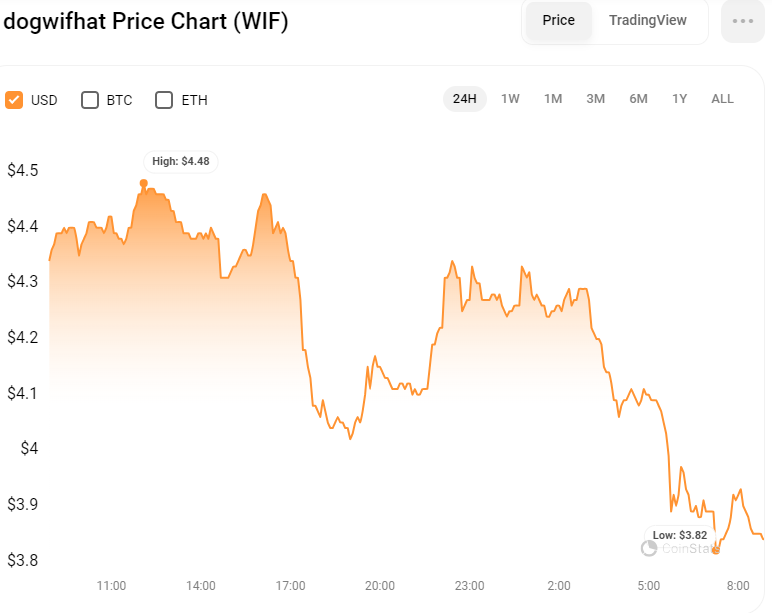
WIF/USD 24-Hour Chart (Source: CoinStats)
Despite the market’s overall positive sentiment, the WIF token has encountered a downturn in the last 24 hours. Opening at $4.41, the token briefly ascended to a daily high of $4.48. However, momentum shifted as bearish forces took charge, driving WIF’s price down to a sharp low of $3.82. The price has since found some stability, hovering slightly above $3.85.
This recent dip could deepen if bearish pressure persists, potentially breaking the immediate support level at the intraday low. On the flip side, a bullish resurgence could challenge the day’s peak, setting it up as a potential resistance point. The token’s future movements hinge on these critical levels as traders watch closely to see which direction WIF will take next.
WIF/USD Technical Analysis
The WIF token has been exhibiting significant volatility on the 4-hour chart, navigating between its all-time high of $4.8 and a two-week low of $1.95. After reaching its peak, the token entered a bearish phase, with its price challenging the 78.6% Fibonacci retracement level.
Currently, the market is at a critical juncture; if the WIF token’s price closes below this level, it’s projected to descend towards the 50% Fibonacci level at $3.10, which may serve as a new support zone. Conversely, a close above the 78.6% level could propel the token towards, and potentially beyond, its all-time high.
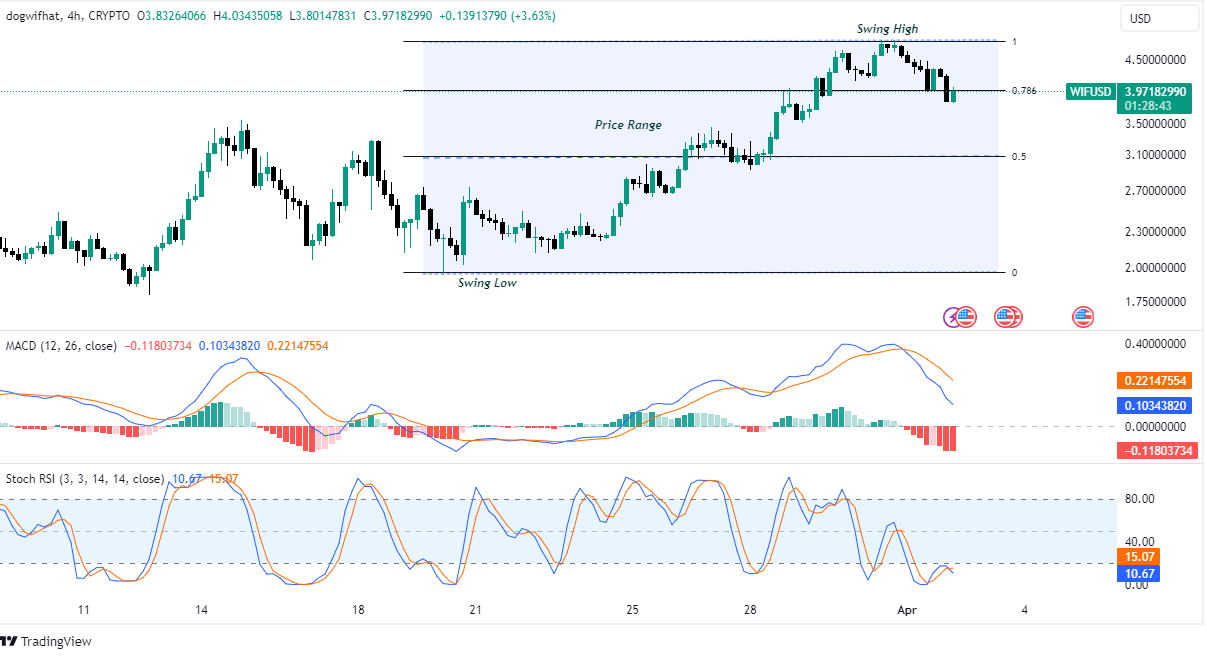
WIF/USD 4-Hour Chart (Source: TradingView)
Technical indicators further illustrate the bearish momentum. The Moving Average Convergence Divergence (MACD) indicator is notably trending downwards, with the MACD line at 0.1034 below the signal line, hinting at continued bearish potential. This is corroborated by the histogram’s expanding red bars below the zero line, reinforcing the bearish market sentiment.
Similarly, the Stochastic Relative Strength Index (RSI) underscores the bearish trend, with a reading of 10.67 below the signal line and firmly in the oversold territory. This positioning suggests that while the current sentiment is bearish, there could be room for a potential reversal or bounce back soon.
Such an oversold condition often precedes a shift in momentum, making it crucial for traders to vigilantly observe WIF’s price action for signs of a reversal before making trading decisions.
Disclaimer: The information presented in this article is for informational and educational purposes only. The article does not constitute financial advice or advice of any kind. Coin Edition is not responsible for any losses incurred as a result of the utilization of content, products, or services mentioned. Readers are advised to exercise caution before taking any action related to the company.
 Price Prediction: Can BTW Sustain Its Breakout Above $0.1032?")


