

- Whales moved 226,435 ETH worth $430M in 24 hours as Ali Charts flagged $1,733 as the level that decides the bullish outlook
- Morgan Stanley listed ETH and SOL ETPs on NYSE Arca at 0.14%, the first wirehouse to offer all three major networks through a standard brokerage account
- Analyst Merlijn called the June breakdown to $1,520 a shakeout, not a reversal, with a weekly close below $1,550 as the only invalidation
Ethereum trades at $1,898.91 on July 29, down 1.09%, pulling back from its intraday high of $1,926.52 after Morgan Stanley launched regulated ETH exposure products and whales redistributed $430M worth of the token in a single session.
ETH Is Holding Between The 0.382 Fibonacci And The Descending Trendline
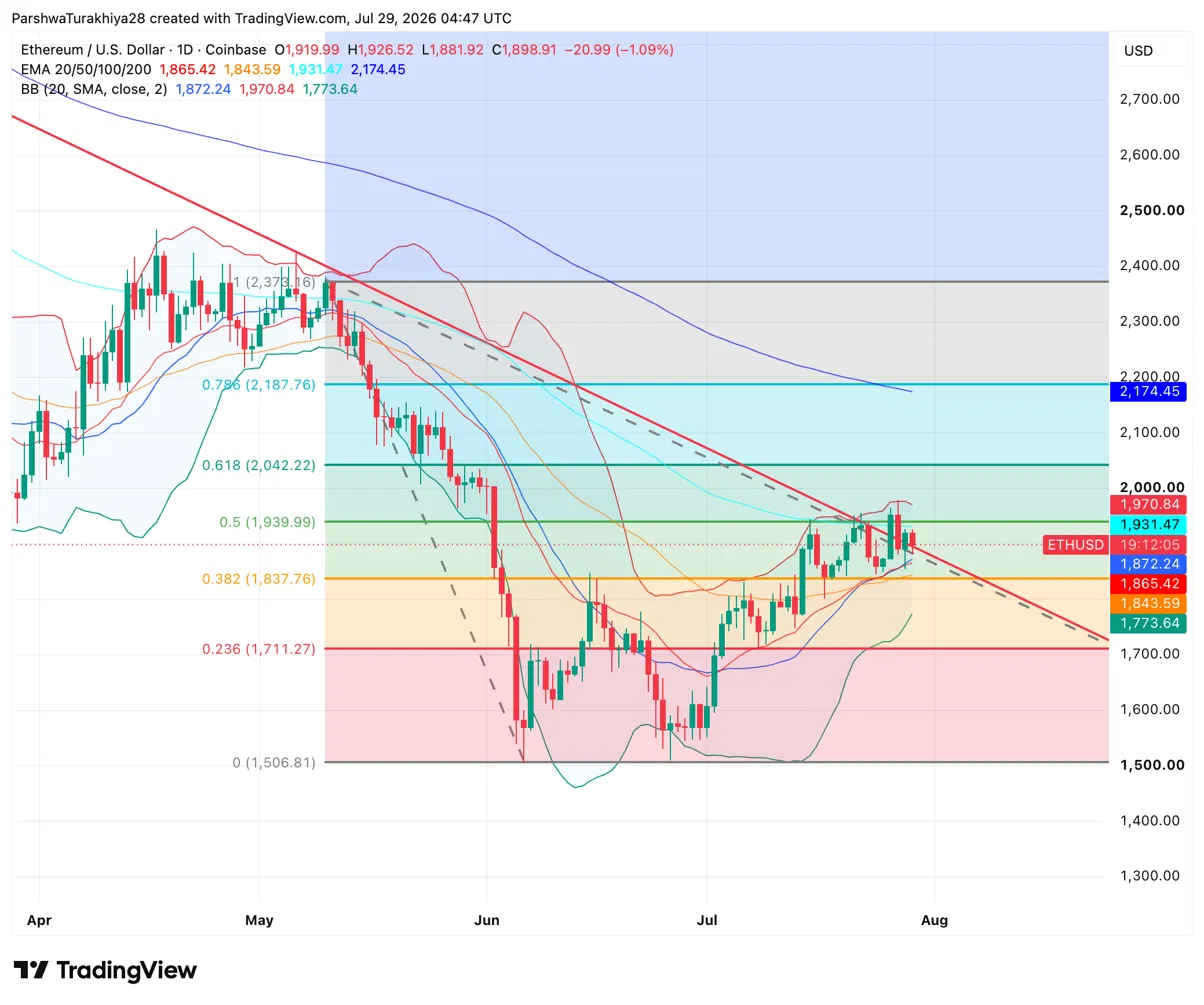
ETH at $1,898 is sitting in a tight zone. The 0.382 Fibonacci at $1,837 holds as support below. The descending trendline from May’s peak sits above, converging with the 0.5 Fibonacci at $1,939 and the 100-day EMA at $1,931 into a resistance cluster that has rejected price multiple times through July.
The 20-day EMA at $1,865 and Bollinger midline at $1,872 have converged into a tight support band just below current price, making the $1,837 to $1,872 zone the level that needs to hold for the recovery structure to stay intact.
What Are The Key Support And Resistance Levels For ETH Today?
Resistance Levels
- $1,931.47 — 100-day EMA, has capped multiple recovery attempts
- $1,939.99 — 0.5 Fibonacci, aligns with the 100-day into a tight cluster
- $1,970.84 — Bollinger upper band
- $2,042.22 — 0.618 Fibonacci, next meaningful target on a breakout
Support Levels
- $1,872.24 — Bollinger midline and 20-day EMA cluster
- $1,837.76 — 0.382 Fibonacci, last floor before the expansion zone
- $1,773.64 — Lower Bollinger Band
- $1,711.27 — 0.236 Fibonacci and Ali Charts’ key level near $1,733
Morgan Stanley Launched ETH And SOL ETPs On NYSE Arca
Morgan Stanley expanded its crypto product suite on July 28, listing Ethereum and Solana ETPs on NYSE Arca under a 0.14% management fee. The products give investors regulated exposure to both networks through a standard brokerage account — the same model Morgan Stanley used for its Bitcoin ETP, which has pulled in over $400M in cumulative inflows since launch.
Related: Audiera Price Prediction: BEAT Gains 40% Weekly as Bulls Push Toward $4.68 Resistance
The ETH product joins BlackRock’s ETHA, Fidelity’s FETH, and eight other spot ETH products already trading. Wall Street’s institutional appetite for ETH exposure is broadening beyond Bitcoin, with a major wirehouses now offering access across all three major networks.
Morgan Stanley Crypto ETP Summary
| Product | Network | Fee | Exchange | Model |
| ETH ETP (new) | Ethereum | 0.14% | NYSE Arca | Standard brokerage account |
| SOL ETP (new) | Solana | 0.14% | NYSE Arca | Standard brokerage account |
| BTC ETP (existing) | Bitcoin | — | NYSE Arca | $400M+ cumulative inflows since launch |
$430M In Whale Activity Raises A Flag At A Critical Level
Ali Charts flagged that 226,435 ETH worth approximately $430M moved in the past 24 hours, one of the largest single-day whale activity spikes in recent months. The move is ambiguous by nature, covering both sales and redistributions, but the scale at a price level that has seen multiple rejection attempts adds caution to the near-term picture.
Ali Charts pinpointed $1,733 as the level to watch, noting that losing it would put the current bullish outlook on hold. That level sits between the 0.236 Fibonacci at $1,711 and the Bollinger lower band at $1,773, making the entire $1,711 to $1,773 zone the critical floor if selling pressure continues.
Trader Merlijn Calls The June Drop A Shakeout, Not A Reversal
Analyst Merlijn The Trader argued that the June breakdown to $1,520 was a deliberate manipulation leg designed to clear out buyers who had accumulated in the $1,745 to $2,500 range over four months. With the price back above $1,860, he described the current phase as the beginning of an expansion rather than another breakdown.
He flagged one more dip toward the range low as likely before the real move begins, and set a clear invalidation: a weekly close below $1,550 would prove him wrong. His framing places current price in the retest phase of a shakeout pattern rather than a continuation of the bear trend.
Ethereum Price Prediction: Upside and Downside Targets
- Upside case: ETH holds the 0.382 Fibonacci at $1,837.76, the Morgan Stanley ETP launch attracts fresh institutional flows, whale redistribution proves to be accumulation rather than distribution, and price clears the 100-day EMA at $1,931.47 toward the 0.618 Fibonacci at $2,042.22 as Merlijn’s expansion phase begins.
- Downside case: The $430M whale move is net selling, ETH loses the 20-day EMA cluster at $1,865 and the 0.382 Fibonacci at $1,837, and price tests Ali Charts’ key $1,733 level with the Bollinger lower band at $1,773 acting as interim support before any deeper retest of Merlijn’s shakeout range low.
Disclaimer: The information presented in this article is for informational and educational purposes only. The article does not constitute financial advice or advice of any kind. Coin Edition is not responsible for any losses incurred as a result of the utilization of content, products, or services mentioned. Readers are advised to exercise caution before taking any action related to the company.