






- ETH/BTC is testing a four-year downtrend as Ethereum’s relative strength improves.
- Past cycles showed ETH/BTC recovering three to six months after copper-gold ratio bottoms.
- Ether ETF net inflows reached $11.22B, but weekly breakout confirmation remains absent.
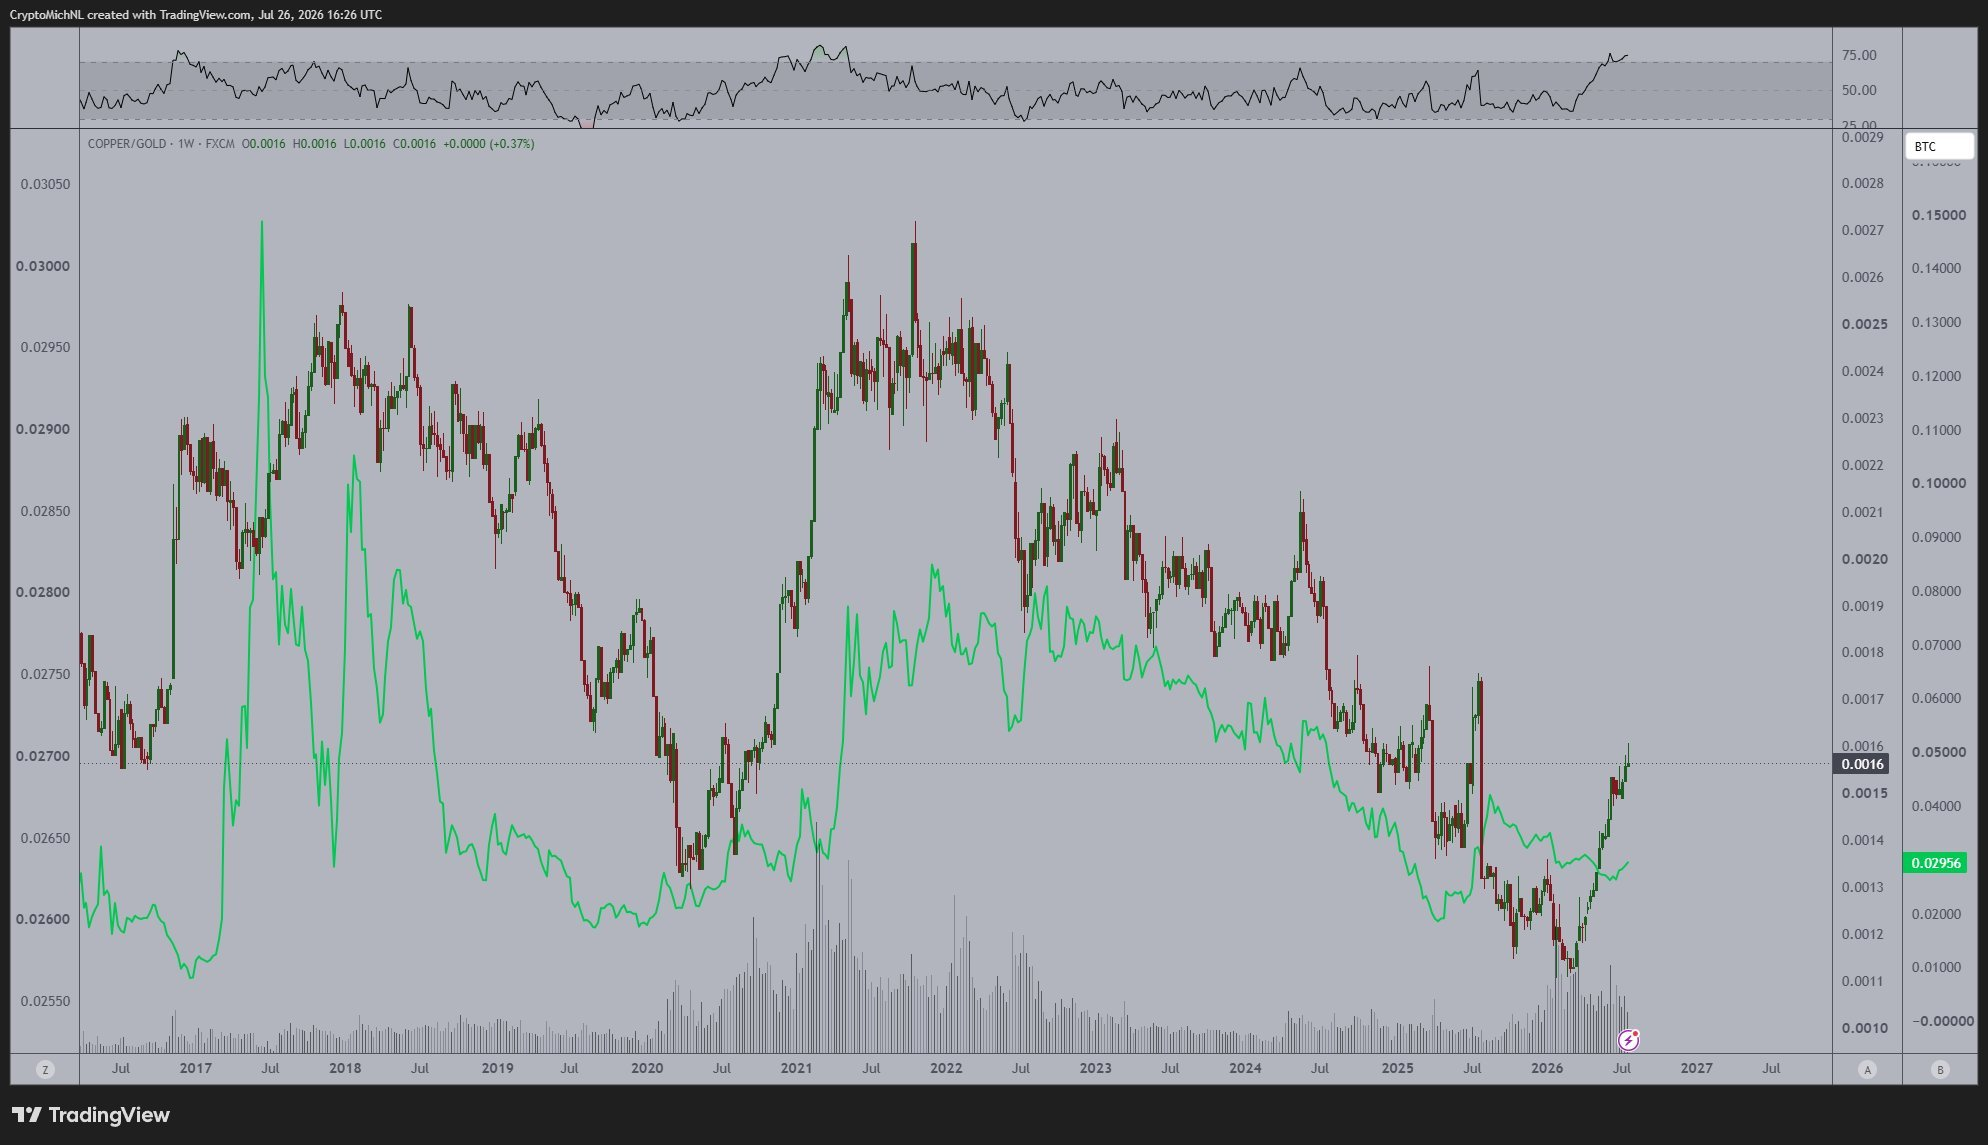
Ethereum is approaching a critical technical test against Bitcoin after almost four years of underperformance, according to market analyst Michaël van de Poppe. His chart links the ETH/BTC recovery with a recent bullish turn in the copper-to-gold ratio.
Van de Poppe said the macro ratio broke its own four-year downtrend during the first quarter of 2026. Meanwhile, ETH/BTC has recovered from lows but remains below its weekly resistance and moving averages.
Copper-Gold Breakout Puts ETH/BTC Resistance in Focus
Van de Poppe’s chart shows the copper-to-gold ratio moving higher after breaking its long-term descending structure. He believes ETH/BTC could follow a similar path if the pair clears its remaining technical resistance.
According to the analyst, previous market cycles showed a three-to-six-month delay between bottoms in the copper-to-gold ratio and subsequent recoveries in ETH/BTC. If that historical relationship continues, Ethereum could challenge its long-term resistance against Bitcoin within the coming weeks.
That comparison matters, as copper and gold often reflect different parts of the economic cycle. Copper tracks industrial activity, while gold usually attracts defensive demand during periods of caution.
A rising copper-to-gold ratio can therefore indicate improving economic confidence and stronger demand for risk assets. Such an environment could support Ethereum’s performance against Bitcoin and encourage wider interest in the altcoin market.
ETF Inflows Rise as Weekly Breakout Confirmation Lags
Meanwhile, institutional demand for Ethereum has strengthened, although daily ETF flows remain uneven. According to Farside Investors, U.S. spot Ether funds recorded inflows from July 20 through July 23.
The products then posted a $70.7 million outflow on July 24 before attracting $11.7 million on July 27. Despite the daily fluctuations, cumulative net inflows reached about $11.22 billion. Even so, macro conditions remain restrictive for risk assets.
CME commentary said futures implied above 60% odds of a September rate increase. At the same time, the 10-year Treasury yield approached 4.6%, creating another headwind for higher-risk markets.
Together, those readings describe a tighter backdrop for risk assets and relative-value positioning. Consequently, a confirmed breakout would require a sustained weekly close above the long-term resistance. ETH/BTC would also need to hold above reclaimed moving averages.
Until those conditions are met, Ethereum shows improving relative strength against Bitcoin rather than a completed reversal. For now, the weekly close remains the benchmark for validating the four-year breakout.
Related: Top 3 Price Prediction for Today: Bitcoin, Ethereum, XRP
Disclaimer: The information presented in this article is for informational and educational purposes only. The article does not constitute financial advice or advice of any kind. Coin Edition is not responsible for any losses incurred as a result of the utilization of content, products, or services mentioned. Readers are advised to exercise caution before taking any action related to the company.




