 and Polygon (MATIC) Dip a Good Option?")
- An analyst predicted an exponential rally for ADA but suggested a possible decline for MATIC.
- Fresh demand for ADA could trigger an upswing toward $1.13, the Fibonnaci extension revealed.
- The MACD on the MATIC 4-hour chart indicated severe bearish momentum as the price might fall to $0.92.
According to analyst Ali Martinez, Cardano (ADA) could repeat its 2018 to 2021 performance this cycle, and breakout to $5. Martinez mentioned this in a March 16 post on X. However, the analyst explained that ADA might consolidate between $0.55 and $0.80 for a while.
After that, he noted that the price might jump to $1.70 before another consolidation period that foreshadows a rally toward $5.
Another token Martinez focused on was Polygon (MATIC). At press time, MATIC’s price had decreased by 8.02% in the last 24 hours. This left the value at $1.04.
Using on-chain data from IntoTheBlock, the analyst explained that MATIC might have found support between $1.02 and $1.05. He added that the support was a result of the 608 million tokens bought by 10,900 addresses around that region.
However, Martinez highlighted that MATIC’s price could fall to $0.91 if bulls fail to defend the support mentioned above.
Cardano (ADA)
Like most altcoins, Cardano’s value dropped. Trading at $0.65 as of this writing implied that the cryptocurrency had lost 7.91% of its value within the last day.
Between March 15 and 16, ADA attempted a steady upswing. But the resistance at $0.73 put a stop to that effort. But that was not the major issue that triggered ADA’s dump. From the 4-hour ADA/USD chart, a decisive breach below the $0.70 was the biggest undoing that led ADA’s price down.
If demand continues to wane, the price of the token might lose another 11.51%, down to $0.59. However, the Fibonacci extension indicator showed that a decline to $0.59 could be profitable for Cardano holders in the near term.
This was because the indicator revealed that the token might rally toward $1.13 (4.236 Fib level). Coin Edition also looked at the Chaikin Money Flow (CMF) to ascertain what could happen to ADA in the short term.
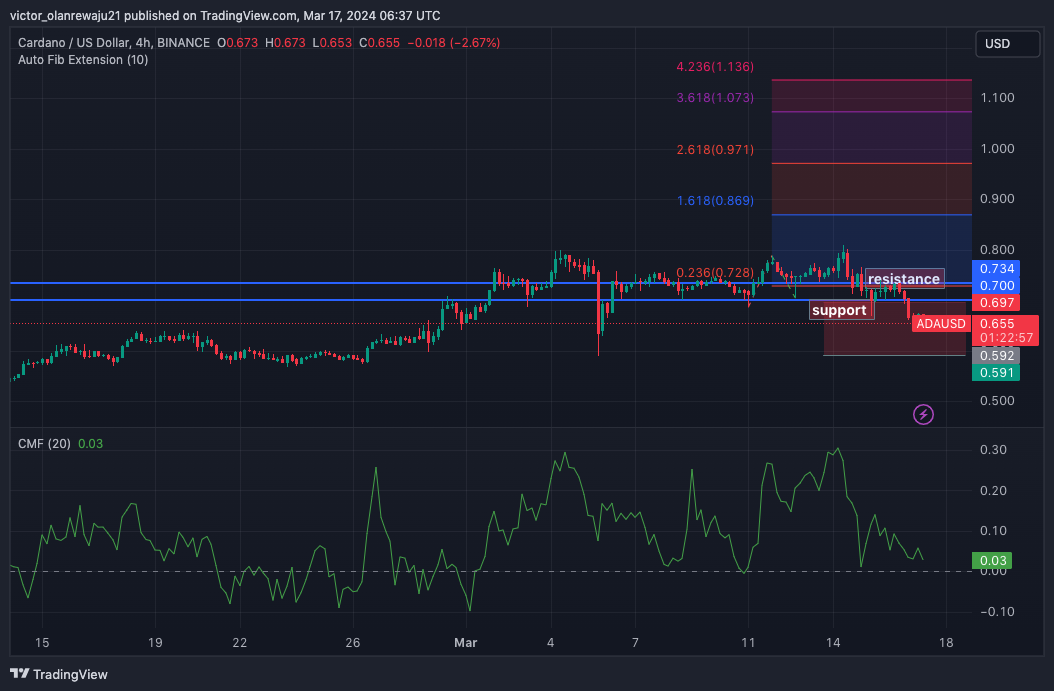
As of this writing, the CMF was in a downward trend like ADA. Since the price and CMF did not diverge, it meant that the price might continue to slide before a rebound appears.
Polygon (MATIC)
The Supertrend indicator on the MATIC/USD 4-hour chart displayed a sell signal at $1.17. However, the buy signal at $1.16 could not hold any water as bears forced the price much lower.
At press time, bulls were trying to find immediate support near $1.03. But inability to resist further bearish pressure could trigger additional downside for MATIC. Should this be the case, the price of the token might decline to $0.92.
Furthermore, the Moving Average Convergence Divergence (MACD) hovered around the negative zone, indicating an intense bearish momentum. The 12-day EMA (blue) sliding below the 26-day EMA (orange) reinforced the notion that sellers were in control.
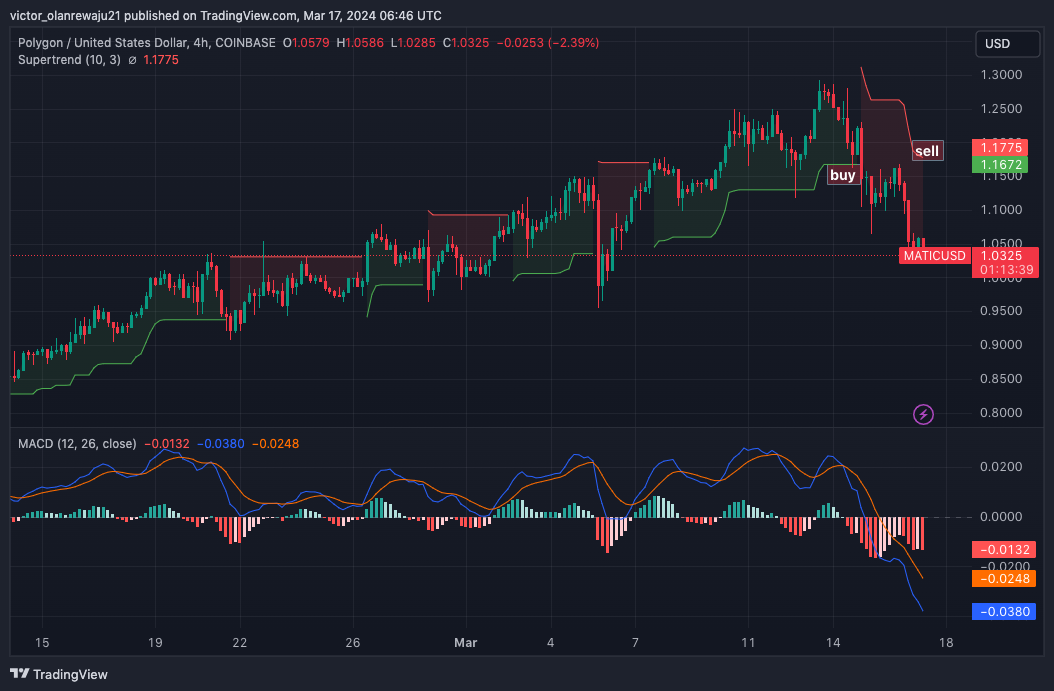
In the current market structure, MATIC might find it hard to bounce. Therefore, a reasonable inference could be that the price might fall below $1, However, a bullish momentum return might drive the token much higher, and hitting $1.50 by that time could be an option.
Disclaimer: The information presented in this article is for informational and educational purposes only. The article does not constitute financial advice or advice of any kind. Coin Edition is not responsible for any losses incurred as a result of the utilization of content, products, or services mentioned. Readers are advised to exercise caution before taking any action related to the company.


