






- Burry says 2026 feels like 1999 as Knicks reach the finals and Nasdaq fell 78% nine months after.
- Six indicators match 1999 levels, including CAPE at 40x, tech at 32% and record margin debt.
- VVIX fell to a yearly low of 87.5 as VIX appears to be bottoming after an extended suppression period.
Michael Burry, the investor who predicted the 2008 financial crisis, has described current market conditions as feeling like the last months of the 1999 to 2000 dot-com bubble. The comparison is not vague. It is specific, data-driven, and uncomfortably precise.
The last time the New York Knicks reached the NBA Finals was 1999. The Nasdaq peaked nine months later and subsequently fell 78%. The Knicks are in the 2026 NBA Finals.
Six Parallels That Are Difficult to Dismiss
The data comparison between 1999 and 2026 is striking enough that it has circulated widely across financial markets this week.
1999:
- Knicks in the NBA Finals
- Nasdaq up 84% that year
- Technology represented 33% of the S&P 500
- CAPE ratio hit 40 times earnings
- Margin debt at record highs
- Hedge funds held 31% of their portfolios in technology stocks
2026:
- Knicks in the NBA Finals
- Nasdaq up 31% over the past 12 months
- Technology represents 32% of the S&P 500
- CAPE ratio at 40 times earnings
- Margin debt at record highs
- Hedge funds hold 33% of their portfolios in big technology stocks
Five of the six indicators are either identical or within a few percentage points of their 1999 readings.
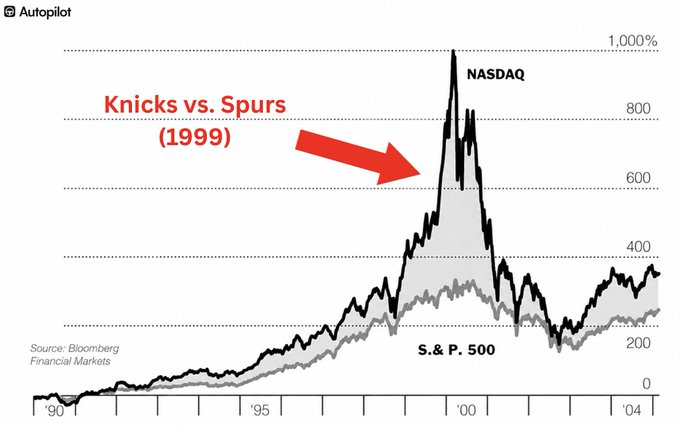
The sixth, the Nasdaq’s annual gain, is lower in 2026, but the direction and concentration of the rally rhyme closely with the conditions that preceded the dot-com collapse.
The VIX Signal Adding to Concerns
Separately, market analyst Neil Sethi flagged that the VVIX, which measures the volatility of the VIX itself, fell to its lowest close of the year at 87.5. The current level sits within what analysts describe as moderate territory for daily VIX moves over the next 30 days.
The broader concern is that the VIX chart appears to be bottoming out after an extended period of suppression. Historically, periods of prolonged low volatility followed by a VIX bottom have preceded significant market disruptions.
The Context That Makes This More Than Coincidence
In 1999, the Fed ran easy money, tech stocks traded on narrative, not earnings, and retail investors had never seen a downturn. In 2026, the S&P 500 hit 7,539, the Nasdaq crossed 30,000, and AI stocks carry valuations built on future projections rather than current fundamentals.
Burry called in 2008 when the data told a story most ignored. He says the data is telling that story again.
Related: Michael Burry Warning Coincides With Stock Drop While Bitcoin Rally Seen as Leverage-Driven
Disclaimer: The information presented in this article is for informational and educational purposes only. The article does not constitute financial advice or advice of any kind. Coin Edition is not responsible for any losses incurred as a result of the utilization of content, products, or services mentioned. Readers are advised to exercise caution before taking any action related to the company.




