


- OP, SNX and ARB were able to print 24-hour gains according to CoinMarketCap.
- Technicals for SNX suggested that there may be a strong breakout towards the upside soon.
- ARB may also experience a breakout in the coming week as a wedge pattern forms on its daily chart.
Layer-2 cryptocurrency projects may rally in the coming few weeks following Ethereum’s (ETH) latest upgrade; EIP-4844. This upgrade is aimed at reducing gas fees for transactions by introducing a special transaction type.
Due to its focus on reducing gas fees for Ethereum’s beacon chain, EIP-4844 is forecasted to amplify the advantages it brings to Layer-2 scaling solutions. Consequently, this enhancement will draw a significant number of investors seeking to engage with Layer-2 chains such as Optimism, Arbitrum, Synthetix, and others.
The past 24 hours saw almost all Layer-2 cryptocurrencies achieve a fair gain. In particular, Synthetix (SNX), Optimism (OP) and Arbitrum (ARB) have seen their prices spike during the past day of trading, according to CoinMarketCap.
Synthetix (SNX)
SNX had reached a high of $2.82 over the past 24 hours as the cryptocurrency soared approximately 3.91% yesterday. During this move, the altcoin’s price rose from a low of $2.593 to a high of $2.833. However, it did retrace to close yesterday’s daily candle off at $2.712. At press time, the altcoin’s price had continued to rise slightly to trade at $2.72.
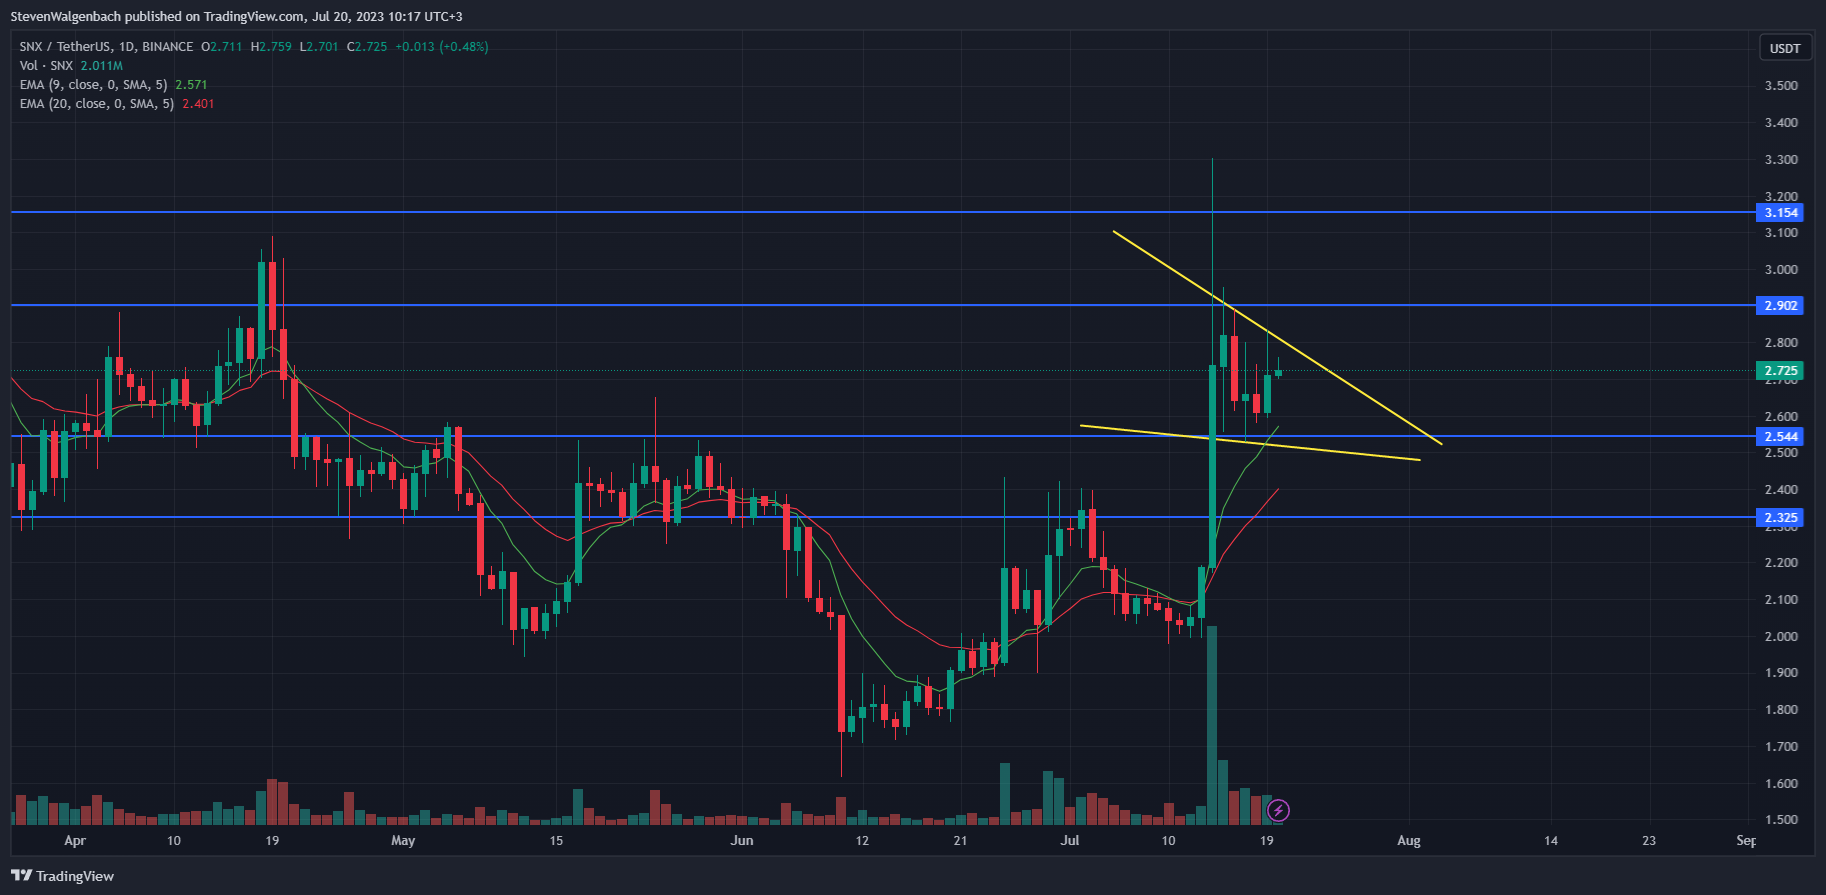
A bullish descending wedge pattern had formed on SNX’s daily chart. Should this pattern be validated in the next 2 weeks it could result in a breakout towards the upside. This potential move may see SNX’s price flip the major resistance at $2.902 into support and possibly challenge the $3.154 resistance as well.
On the other hand, if SNX’s price closes a daily candle below the crucial support at $2.544, then the bullish thesis will most likely be invalidated and the cryptocurrency’s price could be at risk of dropping to the next key support level at $2.325 in the following 48 hours.
There was still some bullish momentum present on SNX’s daily chart, given the fact that the 9-day EMA line was positioned above the 20-day EMA line at press time. This suggested that SNX was still in a short-term bullish cycle and its price may rise in the upcoming couple of days.
Optimism (OP)
OP’s price had surged more than 9% over the past 48 hours to rise from a low of $1.417 to reach a high of $1.633 yesterday. It then pulled back somewhat to close yesterday’s daily candle at $1.565.
At press time, OP was changing hands at $1.56. Nevertheless, the altcoin was still up around 4.46% over the past 24 hours. In addition to strengthening against the Dollar, OP was also up against the two market leaders Bitcoin (BTC) and Ethereum (ETH) by 4.17% and 4.67% respectively.

A positive trend line was present on OP’s daily chart after the altcoin printed higher lows over the past 2 weeks. Furthermore, its price increase throughout the past 48 hours resulted in OP flipping the significant resistance at $1.516 into support as the altcoin continued to trade above this mark at press time.
Should the bullish momentum continue in the coming 48 hours, OP may look to overcome the next resistance level at $1.623 as well. There may, however, be a correction in the cryptocurrency’s price in the coming 24 hours as traders could look to take their profits from the latest price surge.
Should this happen, OP may retest the aforementioned $1.516 mark. Despite the potential correction, the bullish thesis will still be in play if the altcoin closes today’s daily candle above this noteworthy price point. If it fails to close today’s candle above this mark, then it may drop to $1.40 in the next few days.
A bullish outlook is, however, more likely to play out given the fact that the 20-day EMA line was attempting to cross above the 50-day EMA line at press time. Should these two technical indicators cross, it will signal that OP has entered into a medium-term bullish trend and its price may continue to rise in the following couple of days.
Arbitrum (ARB)
The price of ARB was able to rise 1.73% yesterday to achieve a high of $1.2976. Bears did, however, push the altcoin’s price down to close the trading session at $1.2667. Since then, the cryptocurrency’s price had risen slightly to trade at $1.27 at press time. As a result, the altcoin’s price was up 0.84% over the past 24 hours.

A breakout may be in the cards for ARB in the coming week as a wedge pattern had formed on the altcoin’s daily chart. This was after the cryptocurrency’s price printed higher lows and lower highs during the past 5 days.
In the event of a positive breakout, ABR’s price may flip the next major resistance at $1.2981 into support as well as challenge the next significant mark at $1.3682 in the coming week. On the other hand, a breakout towards the downside could lead to the cryptocurrency’s price falling to $1.1736 in the following few days.
The orientation of the 20-day and 50-day EMA lines supported the bullish thesis. However, as the shorter technical indicator was positioned above the longer 50-day EMA line at press time. In addition to this, the margin between the two EMAs was also increasing – suggesting growing medium-term bullish momentum.
In related news, the combined market cap of all Layer-2 cryptos increased 3.2% over the past day of trading. As a result, the total was estimated to be $11,312,673,901 according to CoinMarketCap.
The leader in this category of cryptocurrencies, Polygon (MATIC), saw its price rise more than 4% over the past 24 hours. This also pushed its weekly performance further into the green zone to +7.21%. As a result, the altcoin was trading at $0.7792, which was just slightly off from its daily high of $0.7796.
Disclaimer: The views and opinions, as well as all the information shared in this price analysis, are published in good faith. Readers must do their own research and due diligence. Any action taken by the reader is strictly at their own risk. Coin Edition and its affiliates will not be held liable for any direct or indirect damage or loss.
Disclaimer: The information presented in this article is for informational and educational purposes only. The article does not constitute financial advice or advice of any kind. Coin Edition is not responsible for any losses incurred as a result of the utilization of content, products, or services mentioned. Readers are advised to exercise caution before taking any action related to the company.
 Price Prediction 2026, 2027, 2028, 2029, 2030-2050")


