


 Hits 7-Day High as Bulls Aim to Break Resistance")
- DOT has bounced 55% from October’s yearly low in a remarkable recovery, and is now eyeing the $6.00 milestone.
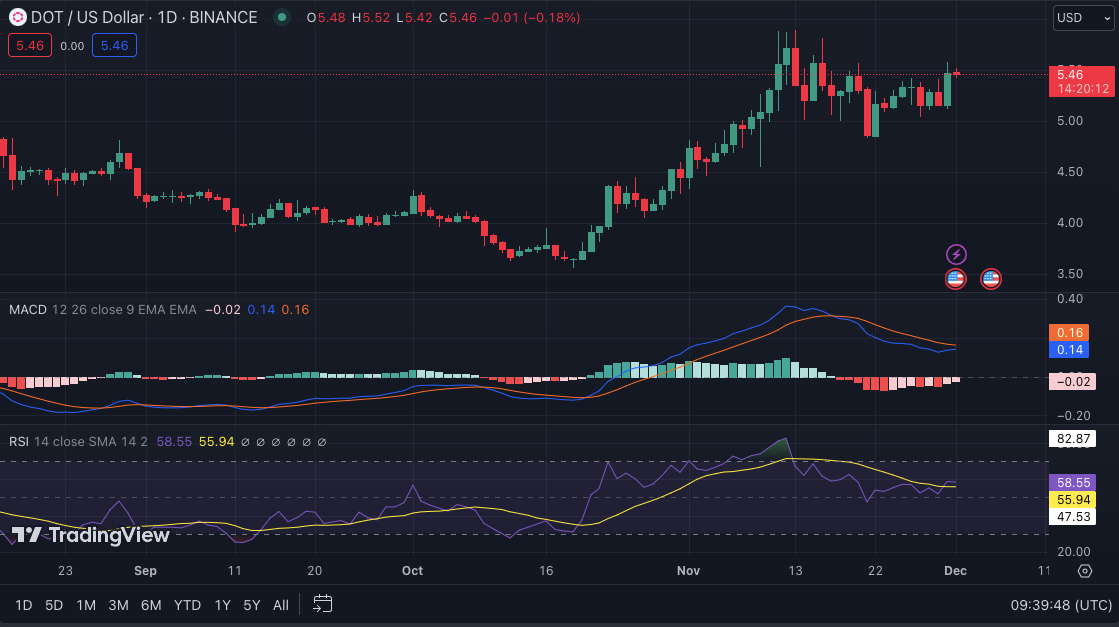
- DOT’s RSI and trading volume signal growing momentum, but MACD hints at potential bearish turbulence.
- Polkadot ventures into traditional finance with a $1 million investment in U.S. treasury bills, bridging blockchain and conventional systems.
Polkadot’s native cryptocurrency, DOT, has recently witnessed a significant surge, exceeding market expectations. Over the past 24 hours, DOT has seen an increase of more than 6%, reaching trading levels around $5.50, the highest in the last week.
According to CoinStats, DOT was trading at $5.46 at press time, a 5.72% increase from its intraday low of $5.16. DOT’s market capitalization increased by 2.12% to $6,832,394,520, demonstrating investor optimism.

This rise represents a substantial recovery from its previous low October low of $3.50, marking an increase of over 55%. Overall, current market trends suggest a strong bullish sentiment, as traders target the $6.00 benchmark.
DOT/USD Technical Analysis
The positive trajectory of DOT is further supported by its performance of moving averages. Trading above these averages suggests a robust market presence. Additionally, a 57% rise in 24-hour trading volume to $293 million underscores the growing investor interest.
On the DOTUSD 24-hour price chart, the Relative Strength Index (RSI) rating of 58.55 and movement above its signal line indicate that positive momentum is building for DOT. If the RSI continues to increase and exceeds 70, it may signal that DOT has entered overbought territory. However, if the RSI begins to fall and falls below 50, it may indicate that DOT’s bullish momentum is fading.
On the other hand, the Moving Average Convergence Divergence (MACD) indicator shows a more volatile future with a bearish crossover, indicating the need for caution in the near term. Furthermore, the MACD histogram exhibits growing negative momentum, supporting a bearish view for DOT. This trend warns traders to be prepared for a possible DOT price drop and set up proper stop-loss levels to mitigate risk.
Polkadot Invests in T-Bills
In a strategic development, the Polkadot’s Web3 Foundation announced its foray into traditional financial assets. The foundation will pilot a $1 million investment in U.S. treasury bills. These will be tokenized on-chain via Anemoy, a platform operating on Centrifuge Chain, a Polkadot parachain.
Anemoy’s Liquid Short Treasury Fund, where the investment is directed, aims to offer Decentralized Autonomous Organizations (DAOs) and investors access to yields from short-term U.S. treasury bills. This initiative represents the Web3 Foundation’s commitment to fostering the integration of real-world assets within the Polkadot ecosystem.
Polkadot’s recent price surge and step into traditional finance marks a new chapter in its foray into real-world assets. As DOT aims for higher price points, the broader impact of its strategic investments will be closely watched by investors and enthusiasts alike.
Disclaimer: The information presented in this article is for informational and educational purposes only. The article does not constitute financial advice or advice of any kind. Coin Edition is not responsible for any losses incurred as a result of the utilization of content, products, or services mentioned. Readers are advised to exercise caution before taking any action related to the company.

: What Happens If You Use an Unlicensed Platform?")


