


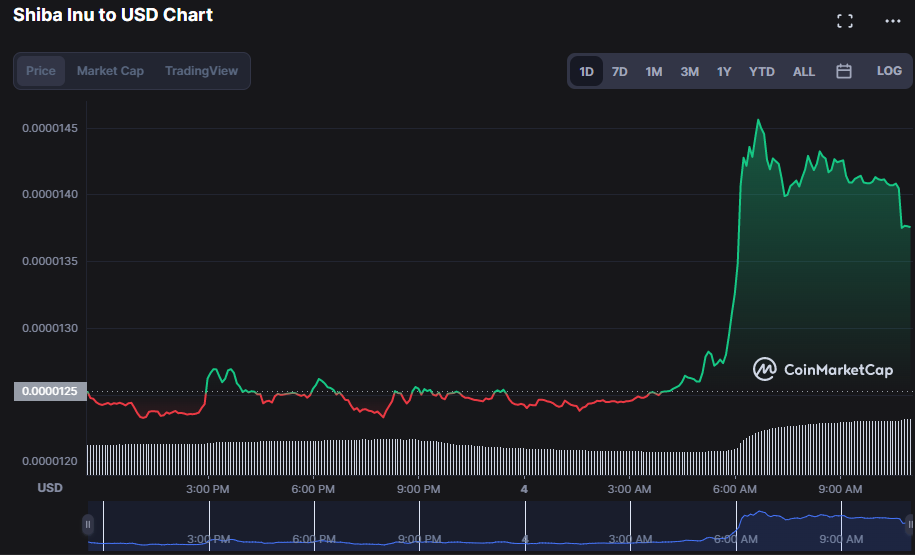
- With the recent upswing, SHIB has reached a new 90-day high price of $0.00001457.
- Current research forecast a sustained upswing for the foreseeable future.
- The up-trending SHIB market finds support around $0.00001232.
After a period of indecision during which bears and bulls wrestled for control, Shiba Inu (SHIB) bulls have just captured the market. As a consequence of the gains made by the bulls, the price of SHIB climbed to a new 90-day high of $0.00001457 during the trading session. At the time of writing, the price has risen 12.13% to $0.00001381, a result of the bullish dominance.
SHIB’s bull run is supported by a rise in market capitalization and 24-hour trading volume of 11.16 % to $7.585,874,251 and 89.82 % to $1.085,241,973, respectively. This spike in SHIB’s market value and 24-hour trading volume indicates that buyers are confident in the stock’s upward trajectory and are prepared to back it up.
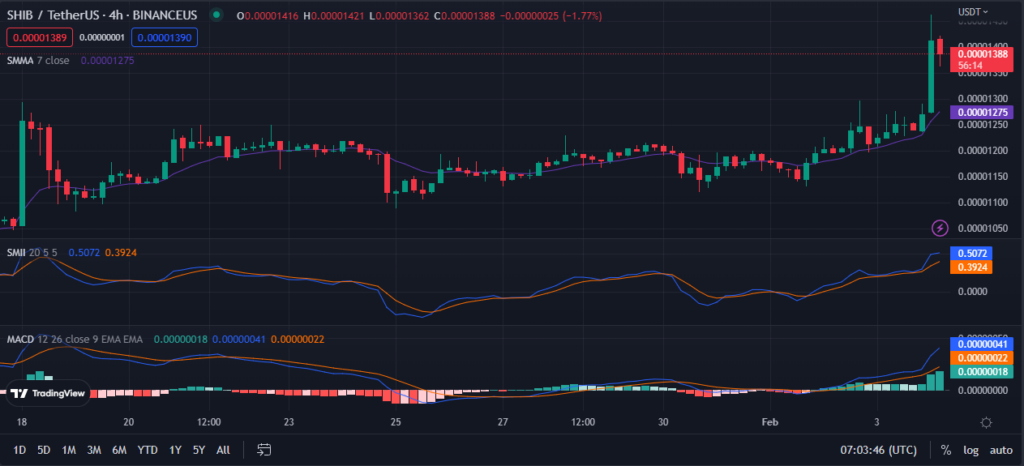
Since the SMI Ergodic Indicator (SMII) has remained above its signal line at 0.5278, indicating that bullish momentum is still strong, the price of SHIB might continue rising.
The market is presently in a positive trend and is anticipated to continue increasing as the Smoothed Moving Average (SMMA) line has been slowly advancing for some time, now reading 0.00001276.
The MACD blue line soars over the signal line with a value of 0.00000041, forecasting prolonged positive sentiment. The bullish trend continues to be supported by the histogram’s favorable direction. Because of this, prices will likely go up soon because the market has a lot of momentum in the correct order.
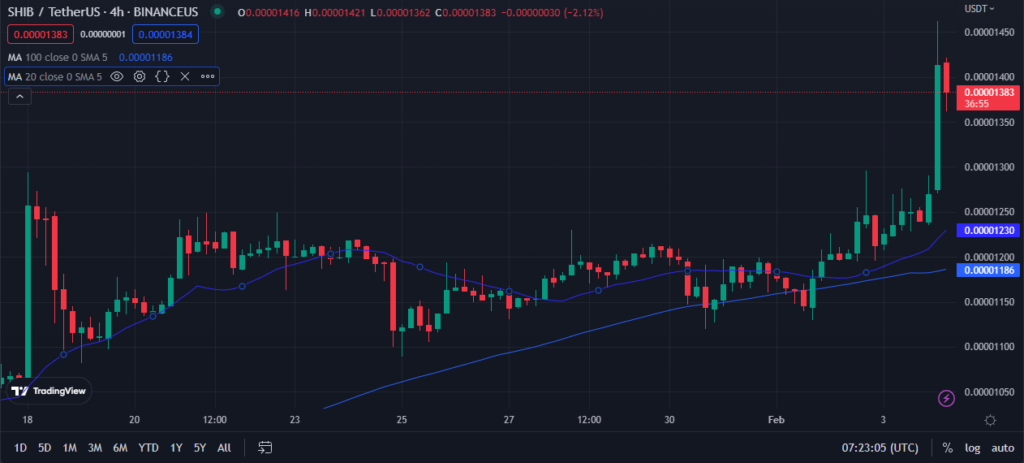
The SHIB/USD price chart shows a bullish crossover as the short-term MA crosses above the long-term MA. The 20-day MA crosses at 0.00001230, while the 100-day MA touches at 0.00001186, confirming the bullish crossover. This crossover gives a strong buy signal for SHIB/USD, as the shorter-term MA crossing over the longer-term MA denotes increased momentum. Since the short-term MA moves faster than the long-term MA, it indicates a more current value of SHIB/USD expectations to rise further. This bullish crossing is a good development for investors eager for an entry point into the SHIB/USD market.
SHIB bulls need to sustain their dominance even after establishing a new 90-day high and break and stay above the present level of resistance.
Disclaimer: The views and opinions, as well as all the information shared in this price analysis, are published in good faith. Readers must do their own research and due diligence. Any action taken by the reader is strictly at their own risk. Coin Edition and its affiliates will not be held liable for any direct or indirect damage or loss.
Disclaimer: The information presented in this article is for informational and educational purposes only. The article does not constitute financial advice or advice of any kind. Coin Edition is not responsible for any losses incurred as a result of the utilization of content, products, or services mentioned. Readers are advised to exercise caution before taking any action related to the company.


