
- S&P 500 crossed a record 7,800 intraday, while Bitcoin stayed about 50% below its peak.
- Bitcoin still faces $65,500 resistance after U.S. spot ETFs post $323.3M net outflows.
- Indian crypto traders should track BTC-INR, USD/INR, and Nifty for firm risk-on signals.
The S&P 500 moved above 7,800 intraday on Aug. 13 before closing at a record 7,798.99. Bitcoin traded near $63,400 on Aug. 13, exposing a widening gap between crypto and record-setting U.S. equities. Indian crypto traders are watching whether that risk appetite spreads beyond American stocks.
S&P 500 Breaks 7,800 as Global Risk Appetite Strengthens
In an X post, analyst Ash Crypto highlighted that the S&P 500 had broken 7,800 for the first time while Bitcoin remained about 50% below its all-time high. The comparison showed the contrasting performance of U.S. equities and crypto.
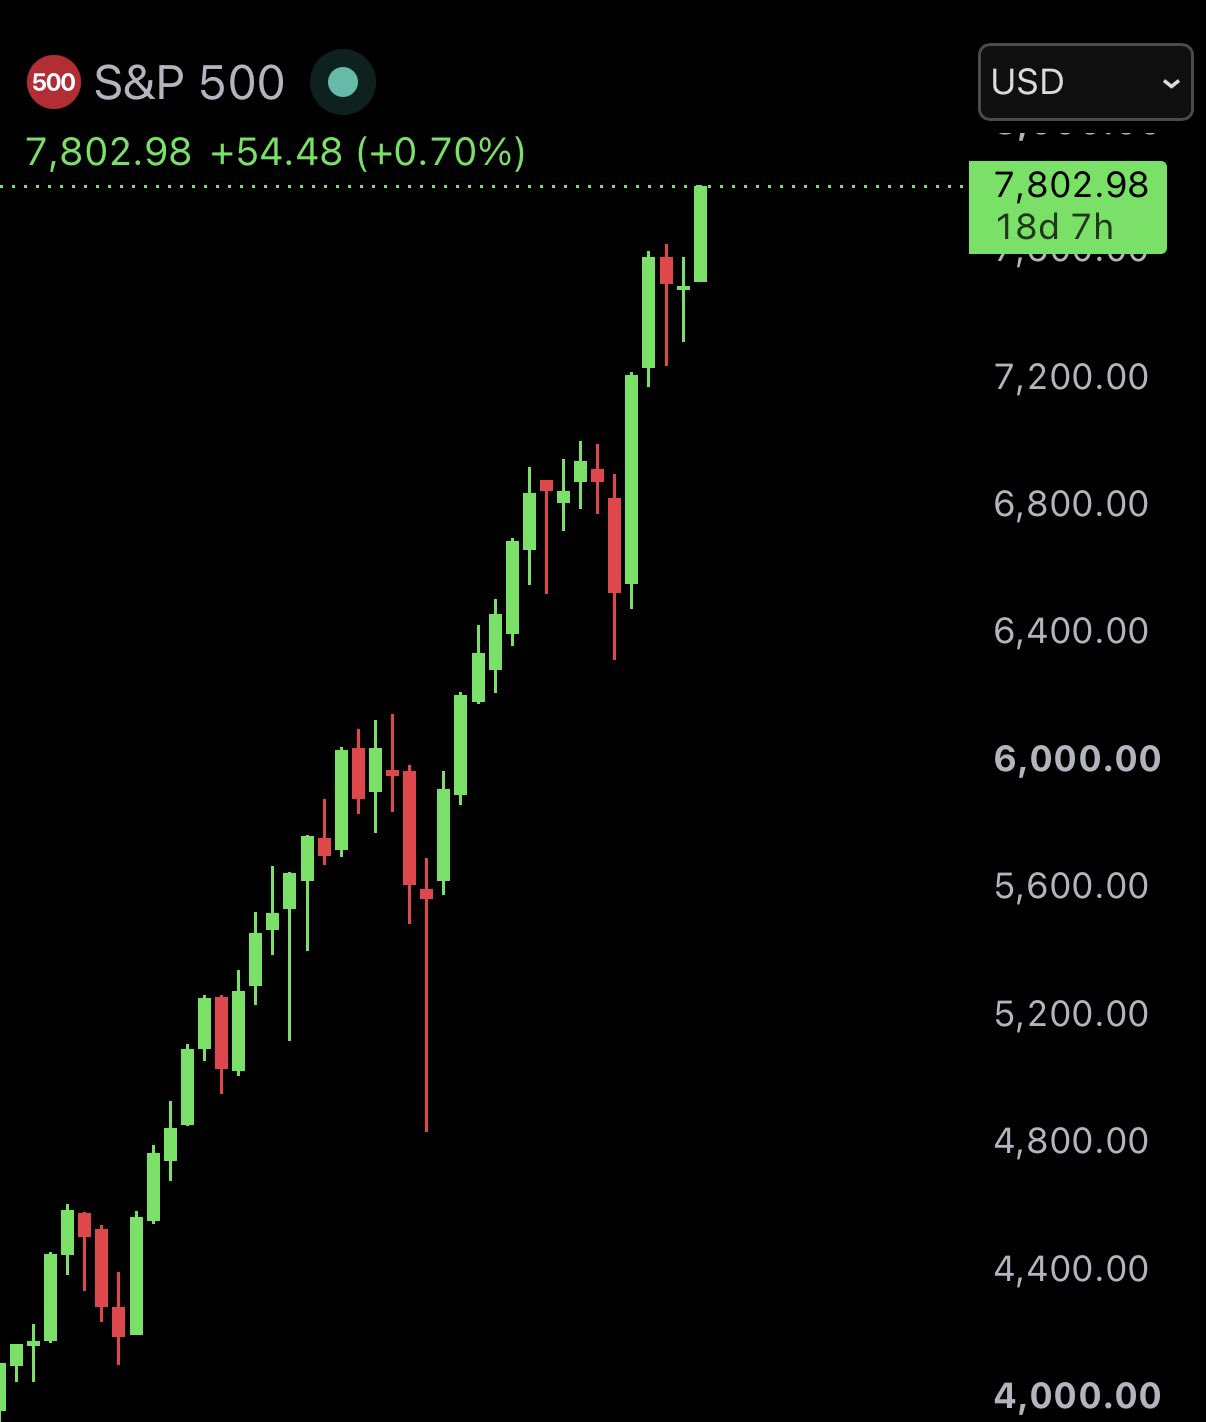
The milestone was an intraday break, not a close above 7,800. The index still gained 0.65% and extended its 2026 advance to about 14%, while the Nasdaq rose 0.81%. That strength gave global investors a more supportive risk backdrop.
Participation also improved beneath the headline. Seven of the index’s 11 sectors advanced, and gaining stocks outnumbered decliners by 1.7 to one. Communication services rose 1.56%, while real estate added 1.34%.
However, trading activity remained restrained. U.S. exchange volume reached 16.1 billion shares, below the 20-session average of 17.5 billion. The lower turnover suggests the record came with improving breadth but without an exceptional rush of new capital.
What Is Driving the Record U.S. Equity Rally?
Cooling producer inflation provided the first catalyst. The U.S. Producer Price Index (PPI) recorded no change in July as lower goods prices offset increases in services and construction. That reading eased immediate concern about another Federal Reserve rate increase.
However, producer prices remained 4.7% higher than a year earlier. The measure excluding food, energy, and trade services increased 0.4% during July, showing that underlying price pressure had not disappeared.
Earnings offered stronger support. LSEG estimates published on Aug. 5 placed adjusted second-quarter S&P 500 profit growth at 31.1% after more than three-quarters of companies had reported. Technology earnings were heading for a 72% increase.
Technology remained central to the session. Sandisk jumped 13.7%, Micron gained 4.2%, Meta rose 2.8%, and Microsoft added about 1%.
Why Bitcoin Has Not Simply Mirrored the S&P 500
Bitcoin lacked the earnings engine supporting equities. It also faced a visible supply barrier. Bitfinex Alpha counted six tests of the $65,000–$65,500 area from Aug. 5 through Aug. 10, but BTC failed to produce a daily close above $65,000.
Low trading volume showed limited conviction behind those tests. The Aug. 8 and Aug. 9 tests marked Bitfinex’s two lowest-volume spot sessions in 30 days. Bitfinex also placed 1.79 million BTC in the $62,000–$65,000 cost-basis range, keeping two-way trading active near break-even.
However, ETF flows then lost momentum. U.S. spot Bitcoin funds attracted $865.3 million from Aug. 3 through Aug. 7. They recorded a combined $323.3 million of net outflows over the next four sessions, including $125.4 million on Aug. 13.
S&P 500 vs Bitcoin: Is the Correlation Returning?
The recent split does not prove that Bitcoin and the S&P 500 have permanently decoupled. It does show that an equity record cannot serve as a stand-alone BTC signal. The assets can respond differently when their immediate sources of demand diverge.
Coinbase Research found that Bitcoin traded almost one-for-one with the Nasdaq 100 in February. That sensitivity later fell close to zero as ETF and digital-asset treasury demand slowed. The finding concerns the Nasdaq 100, so it should not be presented as a direct S&P 500 correlation measurement.
One macro shock can reconnect the markets. A sharp dollar move, liquidity shift, or unexpected Fed decision could affect both assets. However, S&P Global found no stable link to short-term inflation expectations or two-year risk-neutral Treasury yields.
Market structure also keeps Bitcoin more volatile. S&P Global found that leveraged perpetual futures and automated liquidations can amplify price swings. At the same time, futures and spot ETFs have created stronger links between BTC and traditional finance.
What Are Indian Markets Saying? Nifty, Rupee, and BTC-INR
Indian equities did not fully follow Wall Street. The Nifty 50 slipped 0.16% to 24,395.85 on Aug. 13, while the Sensex gained 0.15%. Ten of 16 major sectors declined as oil risks and Middle East tensions offset support from U.S. markets.
The rupee added another layer. USD/INR closed at 95.44 after dollar demand linked to overseas debt repayments and derivative maturities. Frequent Reserve Bank of India intervention limited volatility, while the one-month implied measure fell to 4.2%.
Currency translation matters because BTC-INR broadly tracks Bitcoin’s dollar price multiplied by USD/INR. CoinGecko data placed BTC-INR near ₹60.48 lakh on Aug. 14, down from ₹61.76 lakh on Aug. 8. That marked a decline of about 2.1%, despite a weaker rupee.
Could U.S. Equity Strength Pull Indian Capital Toward Risk Assets?
A durable U.S. rally can improve global risk tolerance, but the Indian evidence remains mixed. Domestic equities did not match the S&P 500’s gain, while elevated oil prices threatened inflation and the trade balance. India imports nearly 90% of its crude requirements, increasing its exposure to energy shocks.
Crypto also faces a higher investment hurdle in India. The Income Tax Department applies a 30% rate to virtual digital asset gains, plus applicable surcharge and cess. That cost can limit any automatic rotation from equities into Bitcoin.
What Indian Crypto Traders Should Watch Next
Bitcoin’s next test lies near the $65,000–$65,500 resistance band. A daily close above that range, supported by stronger spot volume and ETF inflows, would offer clearer breakout confirmation. Until then, the S&P 500 record alone does not confirm a crypto rally.
Indian crypto traders should compare BTC-INR with BTC-USD and USD/INR. If BTC-USD rises while the rupee remains stable, Bitcoin’s dollar move would drive most of the BTC-INR gain. If BTC-USD remains flat, a weaker rupee could still push BTC-INR higher.
Finally, U.S. inflation, employment, and spending data will guide rate expectations before the Sept. 15–16 Federal Reserve meeting. Until Bitcoin clears resistance and fund flows recover, Wall Street’s move above 7,800 remains an equity milestone—not a confirmed signal for Indian crypto traders.
Related: Indian Retail F&O Traders Lost $40.36B in 5 Years, With Losses Every Year
Disclaimer: The information presented in this article is for informational and educational purposes only. The article does not constitute financial advice or advice of any kind. Coin Edition is not responsible for any losses incurred as a result of the utilization of content, products, or services mentioned. Readers are advised to exercise caution before taking any action related to the company.