






- Ethereum exchange reserves have fallen from approximately 16.8 million to 15.1 million.
- Recent ETH price action has been driven primarily by spot market buying and selling.
- Relatively small price movement in ETH could trigger liquidation cascades and volatility.
Analysts reviewing Ethereum’s recent performance have identified several factors behind the cryptocurrency’s underperformance compared to Bitcoin. A CryptoQuant report summed up the scenario by noting that Ethereum shows a widening gap between supply restraint and economic demand.
ETH Exchange Reserves Have Declined
Details of the report show that ETH exchange reserves have fallen from approximately 16.8 million to 15.1 million, while the staking rate has risen from below 30% to 33.9%. That is because more ETH is entering staking, while fewer units remain in centralized exchanges. Such a situation reduces available supply.
The report also noted weaker demand indicators. Lower token burns suggest that base-layer usage is not generating enough fee pressure to reinforce Ethereum’s scarcity narrative. It identified weak user activity as an ongoing sensitivity for ETH, while noting that stablecoin and tokenization growth could eventually support demand.
ETH Futures is Highly Leveraged
Despite ETH’s underperformance, Ethereum futures remain highly leveraged. It signals a potential squeeze as the cryptocurrency appears to be entering a phase where its trading range is becoming increasingly compressed. A CryptoQuant analyst highlighted Ethereum’s Funding Rate, which is currently close to 0.00, noting that it indicates no clear dominance between long and short positions.
Such a scenario suggests that the cryptocurrency’s recent price action has been driven primarily by spot market buying and selling rather than excessive positioning in the futures market. Nonetheless, a significant amount of leveraged open interest is still in the market, as indicated by the Estimated Leverage Ratio, which remains elevated at 0.6. The analyst noted that this could trigger liquidation cascades and increased volatility due to relatively small price movements.
Ethereum’s Current Price Condition
TradingView data shows that Ethereum traded at $1,878 at the time of writing, reflecting an approximately 25% recovery from the sharp decline it experienced last June. While the recovery looks impressive, the cryptocurrency’s trading volume has continued to decline, reflecting weakening momentum and a period of sideways consolidation.
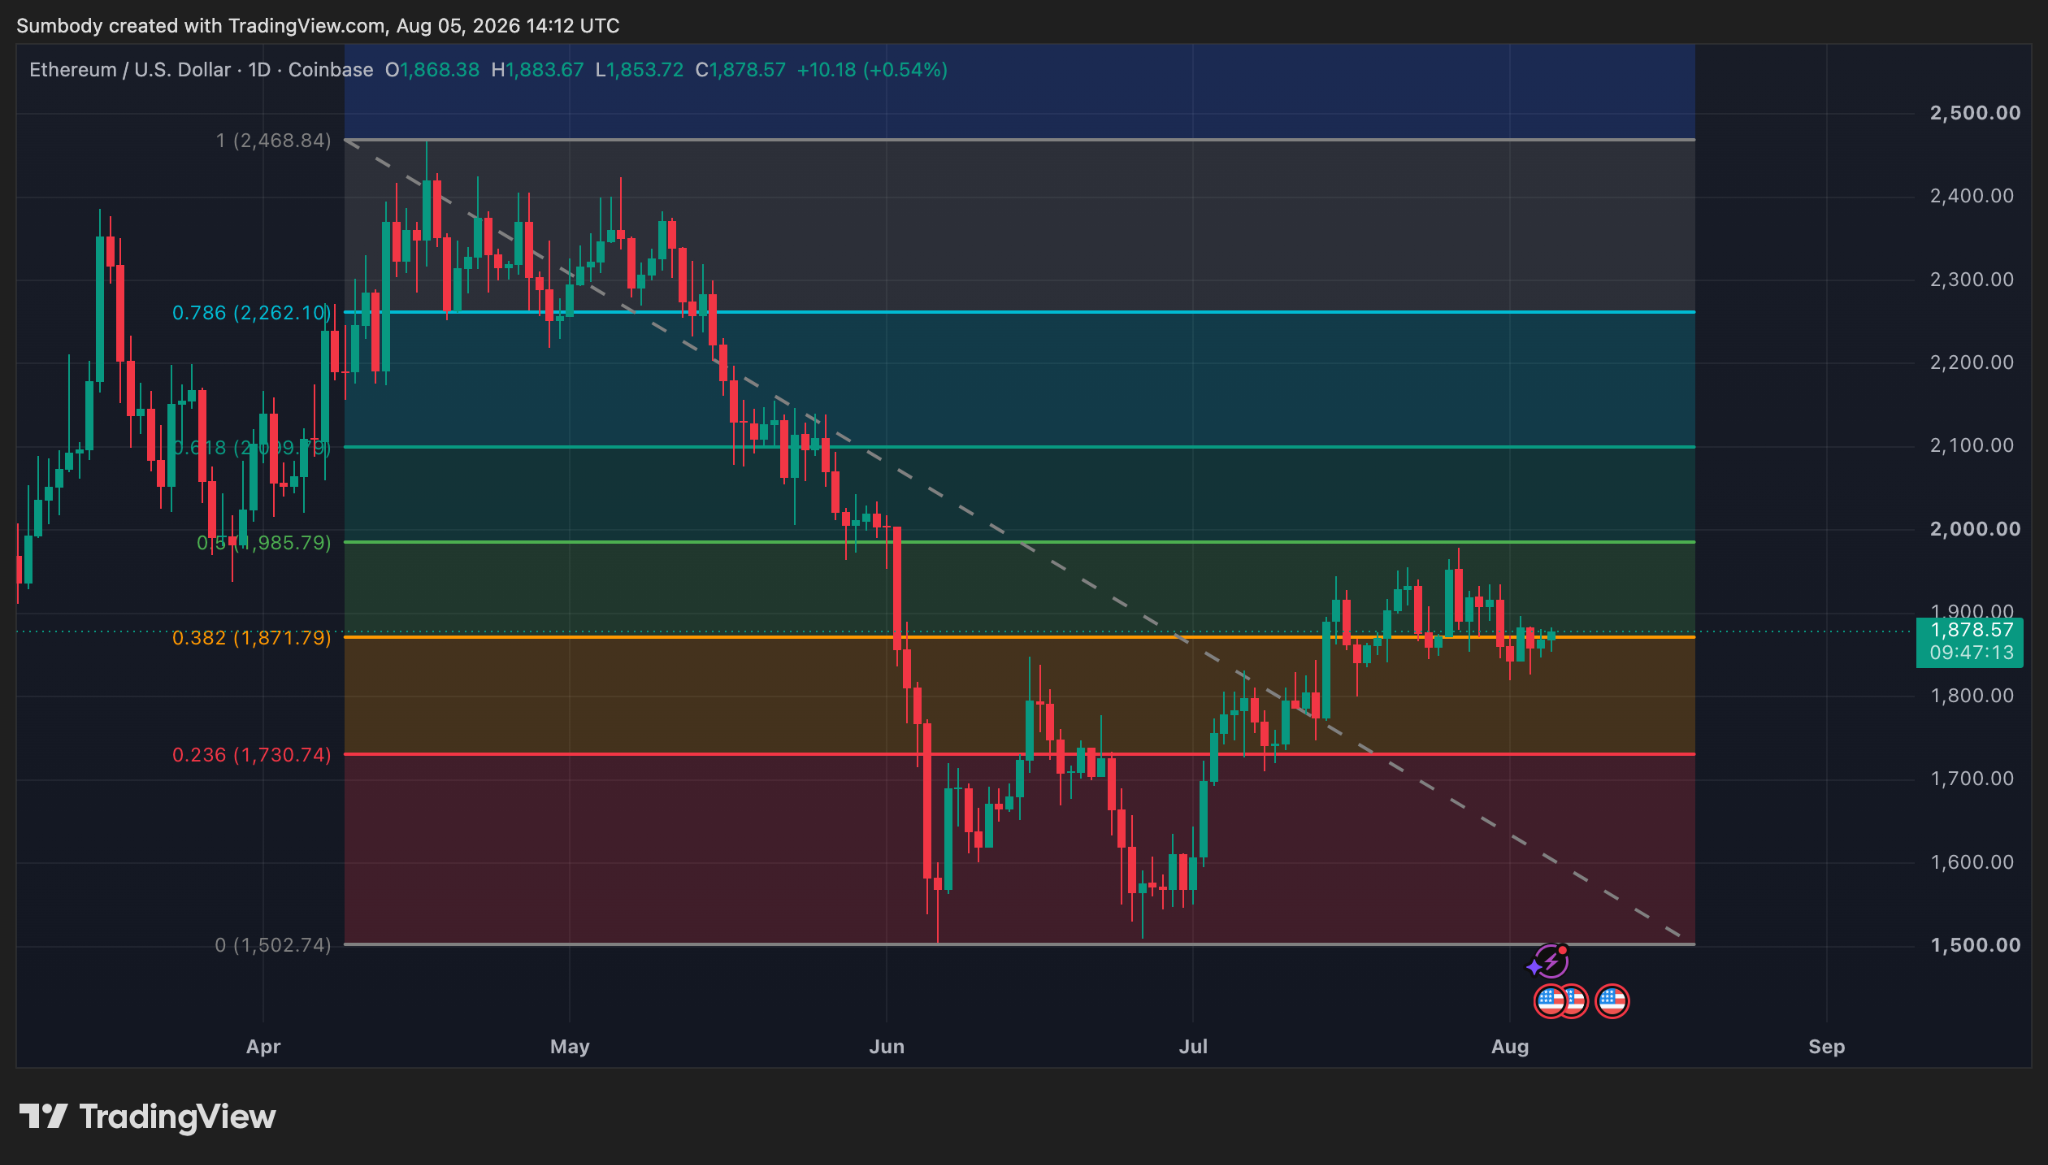
The Fibonacci Retracement on Ethereum’s daily chart shows that the cryptocurrency’s price is currently resting on the 0.382 support. Bouncing off this level would push the price toward the 0.5 Fibonacci level, which coincides with $1,985 and is close to the $2,000 psychological level.
Related: Ethereum Price Prediction: Why Is ETH Still Flat After Five Straight Weeks of ETF Inflows?
Disclaimer: The information presented in this article is for informational and educational purposes only. The article does not constitute financial advice or advice of any kind. Coin Edition is not responsible for any losses incurred as a result of the utilization of content, products, or services mentioned. Readers are advised to exercise caution before taking any action related to the company.




