


- The long/short ratio for AXS and BCH reached extremely low levels.
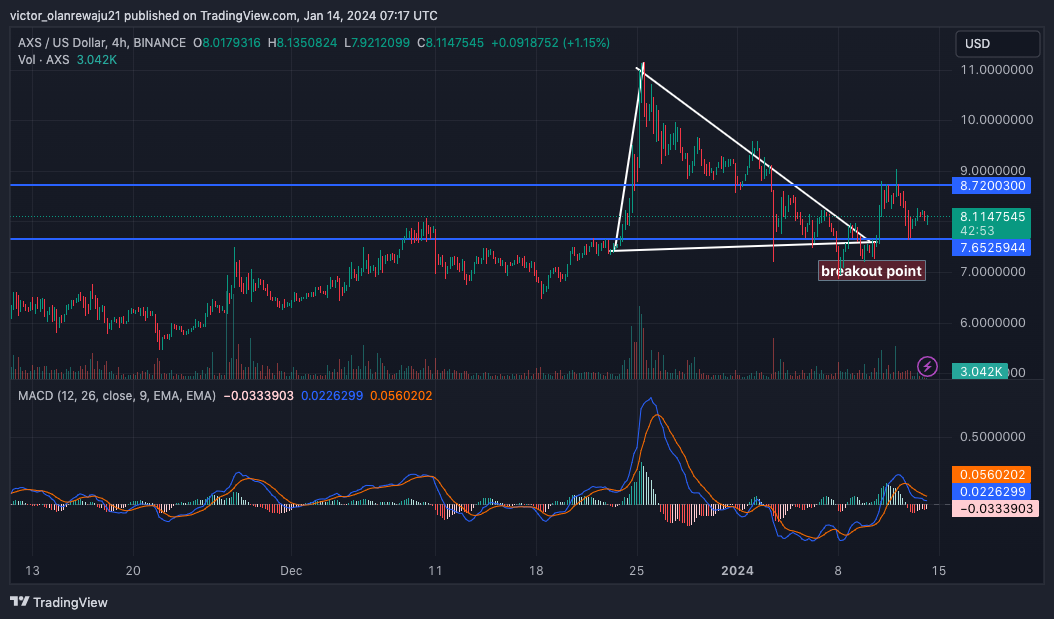
- Bulls have gathered support for AXS at $7.65, indicating a potential rise to $8.72.
- The RSI formed a positive divergence for BCH, suggesting a bounce to $275.
Axie Infinity (AXS) and Bitcoin Cash (BCH) are two cryptocurrencies experiencing a higher level of short position than longs, a Santiment post revealed. However, the on-chain analytic platform noted that the negative sentiment around them could be the catalyst that leads to a rebound.
From the post, the on-chain analytic platform mentioned that traders are optimistic about a recovery from many altcoins. But BCH and AXS were exceptions.
However, the pessimism of this sort is sometimes good for cryptocurrencies. But this only occurs if some buying pressure appears when the long/short ratio is extremely low. In this case, AXS and BCH prices might head in the upward direction.
Axie Infinity (AXS)
At press time, AXS had bounced off the $7.95 and was trading at $8.12. The jump meant that the token had an added a mild 1.14% in the last 24 hours.
From the 4-hour chart, AXS formed an asymmetric triangle between December 25 and January 10. This pattern led to a breakout as the price climbed to $8.72. However, rejection at the same point forced AXS back to $7.65 which bulls have now seen as support for the potential uptrend.
The MACD indicator displayed red histogram bars, indicating an increase in selling pressure. However, this bearish convergence could be neutralized if bulls overpower bearish momentum.
If the price maintains its positive above $8, it could rise above the resistance at $8.72. Should this be the case, AXS could head toward $10 in the coming week. But if bears continue to dominate the market, a breakdown below $7.65 could be possible and a 5% correction could happen.
Bitcoin Cash (BCH)
BCH rose to a ceiling of $298.40 on January 12. However, profit-taking pulled the price down to $252 before its recent recovery to $256.19.
Indications from the RSI showed a positive divergence, suggesting that the price action could be ready for another increase. If this divergence triggers the RSI reading above 50.00, then BCH might climb to $275 for a start.
Like AXS, this potential movement would need an increase in buying pressure. This potential was also confirmed by the Money Flow Index (MFI).
As of this writing, the MFI was 48.17. Values of the MFI over 80 suggest that an asset is overbought. On the other hand, a decline below 20 indicates that it is oversold.
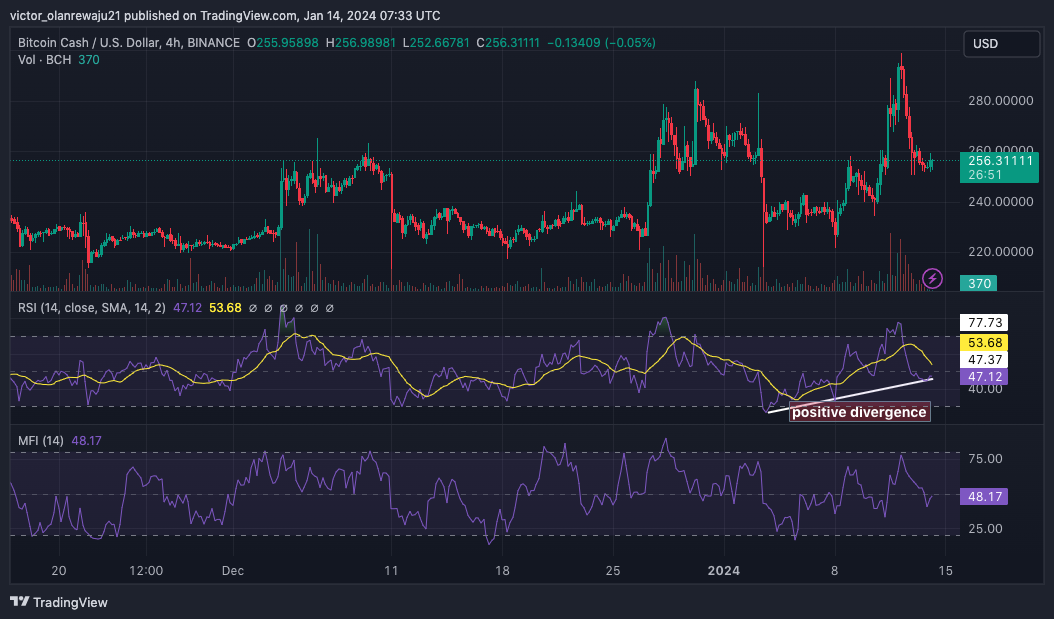
So, the MFI reading here, implies that BCH had evaded falling to oversold conditions. Should the MFI continue to rise, it could foreshadow a price increase for the cryptocurrency.
Disclaimer: The information presented in this article is for informational and educational purposes only. The article does not constitute financial advice or advice of any kind. Coin Edition is not responsible for any losses incurred as a result of the utilization of content, products, or services mentioned. Readers are advised to exercise caution before taking any action related to the company.
 Price Prediction 2026, 2027, 2028, 2029, 2030-2050")
 Price Prediction 2026, 2027, 2028, 2029, 2030-2050")


