

- XRP trades near $1.5006 after rebounding from the $0.9862 monthly range low.
- The $1.00-$1.35 reaction zone remains key before a test of $1.6999 resistance.
- A break above $1.6999 would expose $2.4172 before $2.8361 buy-side liquidity.
XRP has moved back inside its $0.9862-$1.6999 monthly range on the weekly chart after rebounding sharply from the lower boundary. The setup now centers on whether the XRP price can hold above the reaction zone and eventually clear $1.6999. This structure keeps the monthly range high as the immediate barrier while preserving the $2.8361 liquidity level as the chart’s larger upside reference.
| Chart Price | Monthly Range High | Local High | Buy-Side Liquidity |
| $1.5006 | $1.6999 | $2.4172 | $2.8361 |
Monthly Range Reclaim Puts $1.6999 at the Center
As of press time, XRP is trading near $1.5006 on the weekly Binance chart after a prolonged decline reached the $0.9862 monthly range low. The reaction at that boundary returned the token’s price inside the established $0.9862-$1.6999 range.
However, the recovery remains below its upper limit. That distinction matters, as the chart uses weekly candles, while the reclaimed structure itself is monthly. The setup is therefore a weekly-chart recovery inside a monthly range.
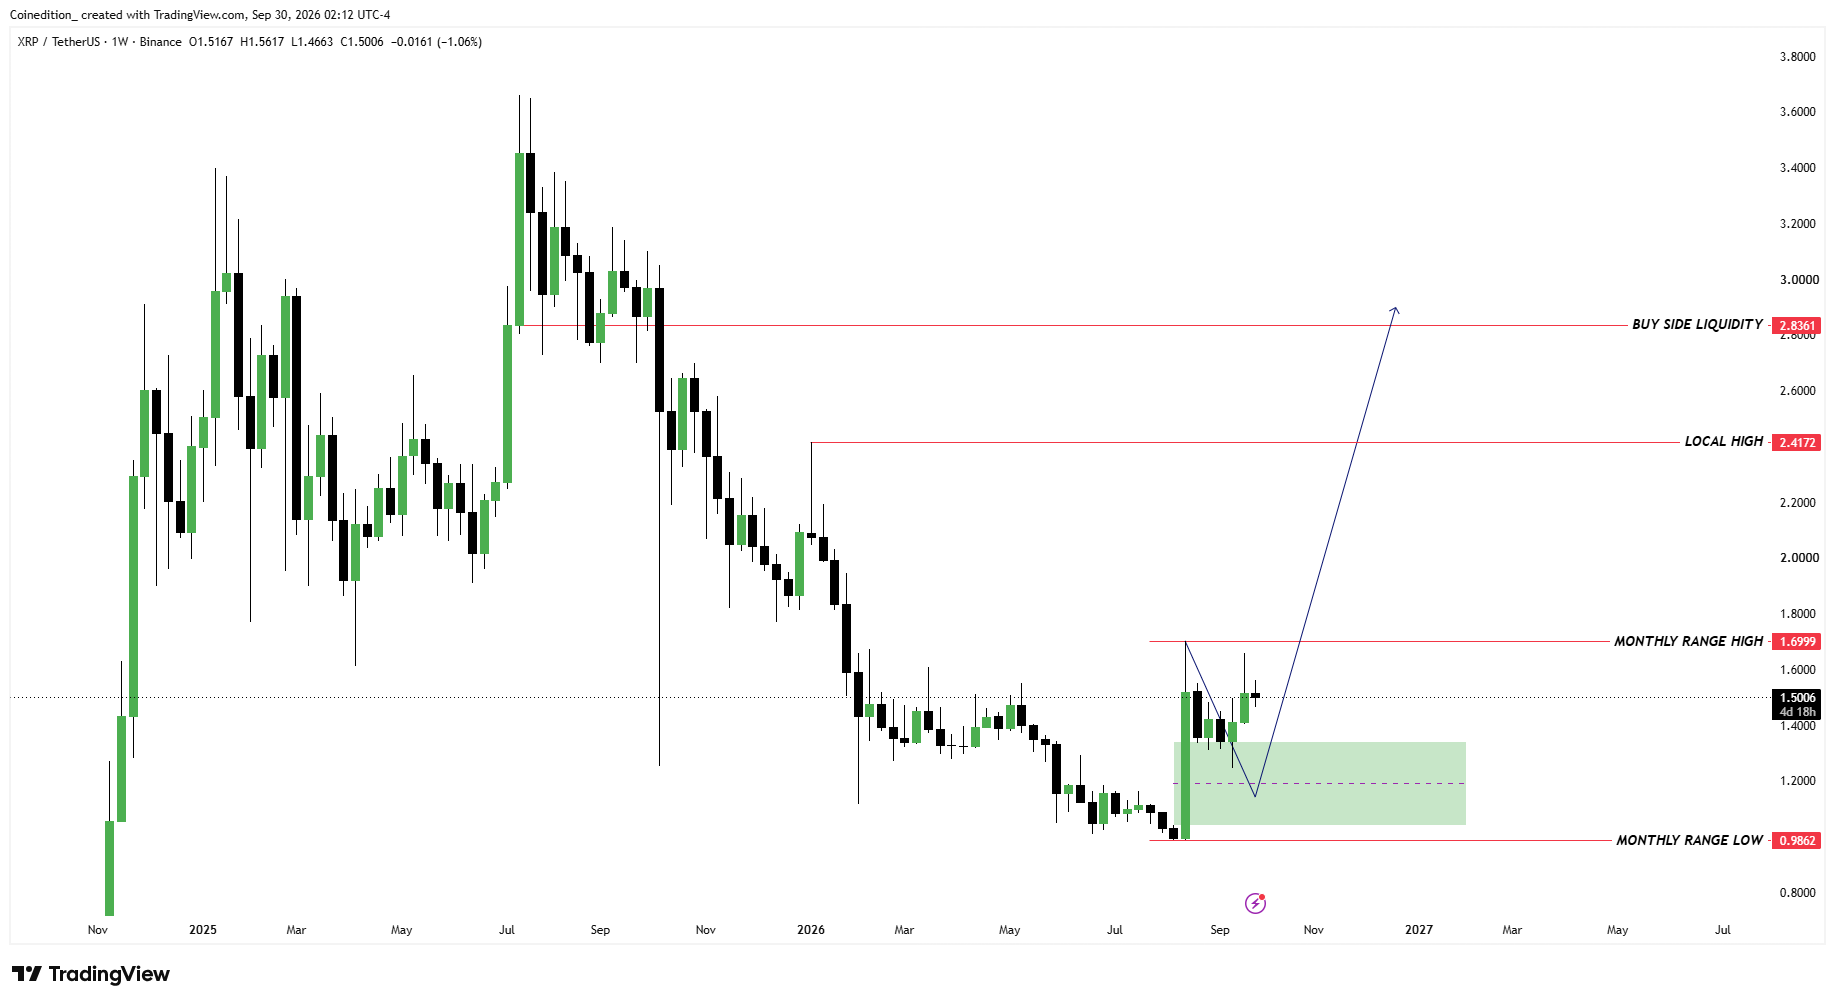
From $1.5006, XRP’s price needs an advance of about 13.3% to reach $1.6999. That level is the first major technical threshold in the mapped sequence. A sustained move above $1.6999 would move attention toward $2.4172, which the chart identifies as the next local high.
$1.00–$1.35 Reaction Zone Shapes the Pullback Structure
The projected path also allows for a retracement before any attempt to challenge the monthly range high. The highlighted $1.00-$1.35 green zone is the principal reaction area on the chart. It sits directly above the $0.9862 monthly range low.
A pullback into that zone would keep the XRP price within the broader monthly structure while testing whether buyers can defend the rebound. If the zone holds, the charted sequence returns attention to $1.6999. Clearing that level would then expose the next higher reference at $2.4172.
The setup therefore follows a defined progression rather than a direct move toward $2.8361. XRP’s price must first preserve the reaction zone, then reclaim the monthly range high before higher liquidity levels become relevant.
$2.4172 Local High Stands Before $2.8361 Buy-Side Liquidity
Above $1.6999, the chart marks $2.4172 as the local high and the first major objective outside the monthly range. That makes $2.4172 an intermediate level rather than the final target shown on the chart.
Beyond $2.4172, the larger buy-side liquidity objective sits at $2.8361. Therefore, the XRP price would need to clear both $1.6999 and $2.4172 before that higher liquidity area comes into focus.
The mapped path therefore contains three clear stages: defending the reaction zone, breaking the monthly range high, and challenging the local high. Meanwhile, a sustained break below $0.9862 would invalidate the recovered monthly structure and remove the charted route toward the higher levels.
Key XRP Levels That Define the Expansion Path
| Level | Role in Current Structure |
| $2.8361 | Larger buy-side liquidity objective |
| $2.4172 | Local high above the monthly range |
| $1.6999 | Monthly range high and breakout threshold |
| $1.00–$1.35 | Primary reaction and pullback zone |
| $0.9862 | Monthly range low and structural invalidation |
EXPANSION CASE
Holding the $1.00-$1.35 reaction zone keeps the mapped structure intact. Likewise, a move above $1.6999 would place $2.4172 first, followed by $2.8361.
FAILURE CASE
A sustained move below $0.9862 would invalidate the monthly-range recovery and remove the higher liquidity objectives from the current chart sequence.
BOTTOM LINE
Overall, the weekly chart shows XRP firmly back inside the monthly range after rebounding from the $0.9862 lower boundary. The $1.6999 range high now serves as the key breakout threshold, with $2.4172 marking the next major objective before the $2.8361 buy-side liquidity area comes into focus.
FAQ
XRP has moved back into its 0.9862–1.6999 range, signaling renewed buyer strength.
It’s the key breakout level that must be cleared for further upside.
It could target $2.4172 next, with $2.8361 as the larger objective.
A key support area where buyers are expected to defend price.
A sustained drop below $0.9862 would break the bullish structure.
Related: SOL Price LIVE: Tuesday Range Manipulation Could Drive a Move Toward $124.13
Disclaimer: The information presented in this article is for informational and educational purposes only. The article does not constitute financial advice or advice of any kind. Coin Edition is not responsible for any losses incurred as a result of the utilization of content, products, or services mentioned. Readers are advised to exercise caution before taking any action related to the company.