

- XRP price prediction stays bullish above $1.37, targeting $1.65 first and $1.70 next
- XRP spot ETFs posted an 11th straight week of inflows, adding $75.59 million last week
- XRP closed October lower in 8 of 13 years, with a median loss of 2.97%
XRP price prediction for October stays bullish above $1.37, the level XRP needs to hold as a tightening triangle forces a decision.
XRP Price Analysis: Can XRP Break Out of Its Triangle in October?
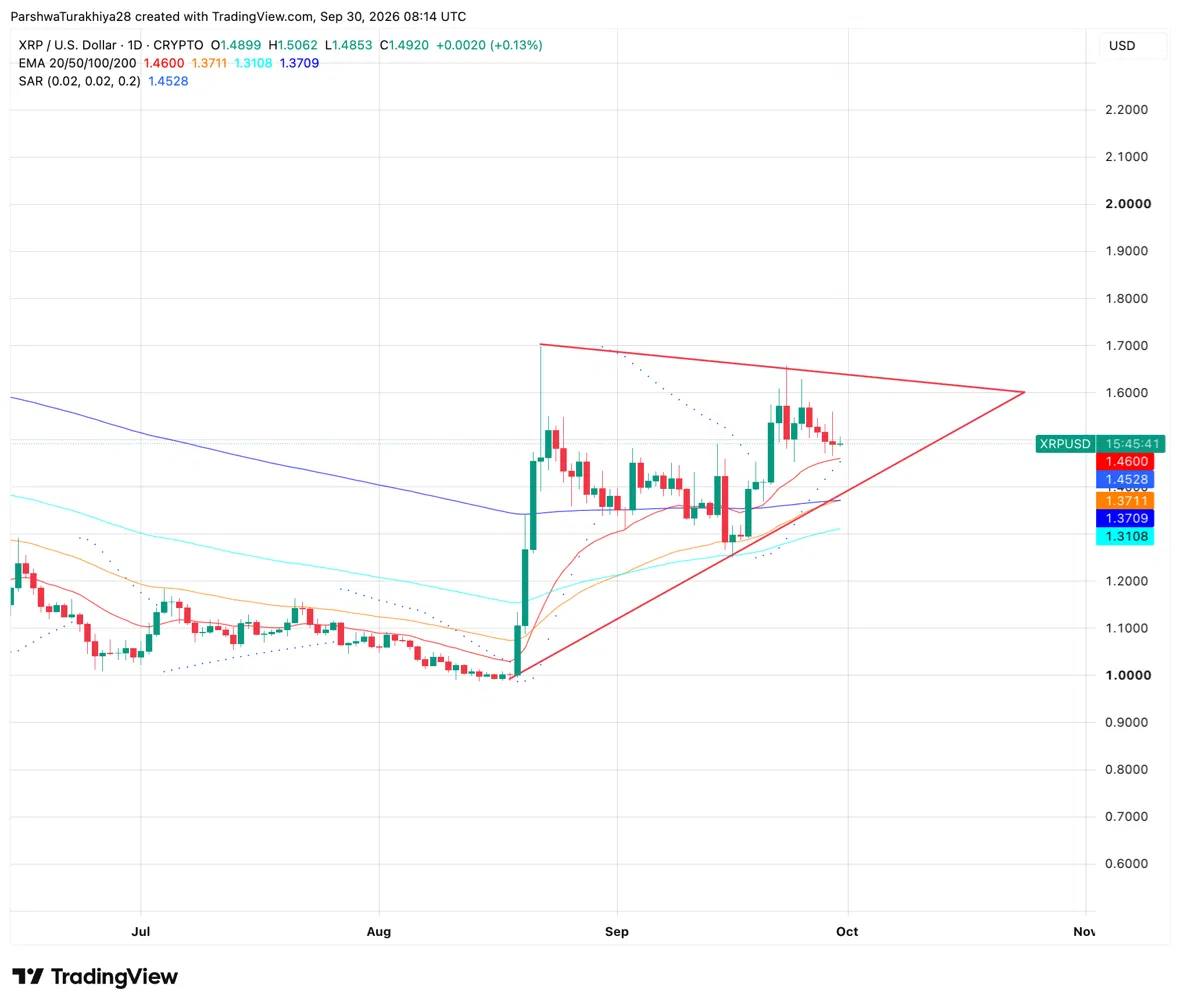
XRP is running out of room inside a triangle, so a break one way or the other is likely before October ends. Price trades near $1.49 between a falling upper line from the $1.70 August high, now near $1.64, and a rising lower line from the roughly $1.00 mid-August low, now near $1.38. The lines meet around $1.60 in late October, and because the lower line keeps climbing, it will sit near today’s price by mid-October.
XRP holds above the 20-day exponential moving average (EMA), a trend line that weights recent prices more heavily, at $1.46. The Parabolic SAR, a trend tool that places dots under price in uptrends, reads $1.45, and together they keep the short-term trend leaning up. Below them, the lower line sits almost on top of the 50-day and 200-day EMAs at $1.37, stacking three supports in one zone, while the 100-day EMA at $1.31 still trails the 200-day.
Related: Bitcoin Price Prediction October 2026: BTC Eyes $90,000 in October as Fed Hike Odds Slide Below 50%
The late-September high near $1.65 stalled at the upper line, so a daily close above about $1.64 would be the first sign the triangle has resolved upward.
XRP Support and Resistance Levels, October 2026
| Type | Price |
| Resistance | $1.51 |
| Resistance | $1.65 |
| Resistance | $1.70 |
| Support | $1.46 |
| Support | $1.37 |
| Support | $1.31 |
XRP October Seasonality: Eight Down Years in 13
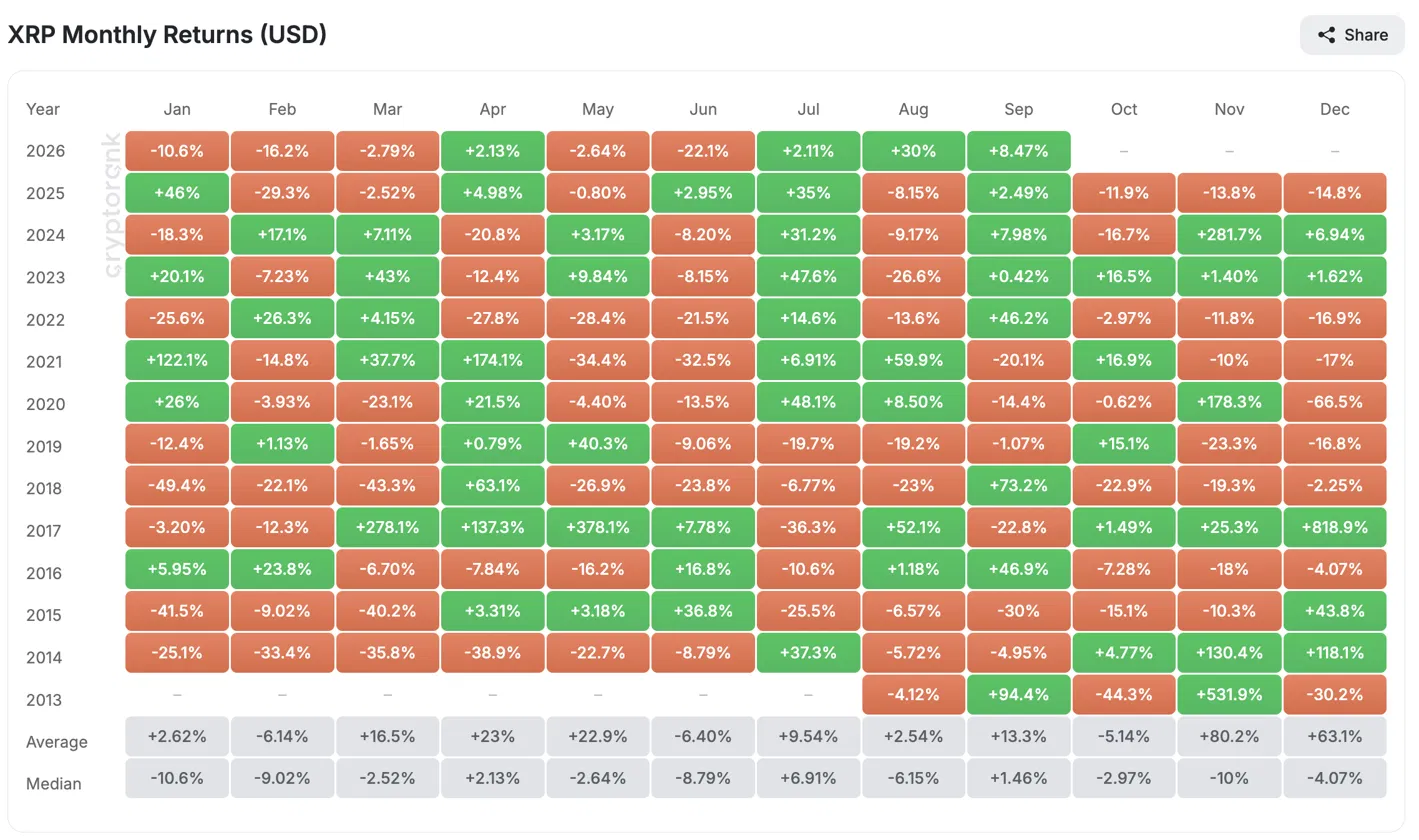
XRP has closed October lower in eight of 13 years since 2013, with an average loss of 5.14% and a median loss of 2.97%. The 44.3% drop in 2013 and the 22.9% drop in 2018 pull the average down, so the median is the better guide. The last two Octobers fell 11.9% in 2025 and 16.7% in 2024, and the best October in the table was 16.9% in 2021.
XRP is up 8.47% in September so far against a September median of 1.46%. Applied to the current price near $1.49, the median October loss implies about $1.45, which lines up with the Parabolic SAR, and the average implies about $1.42. Both are historical references rather than targets.
Related: Ethereum Price Prediction October 2026: ETH Targets $3,000 in October as Short Positions Stack Up
XRP News: Ripple and CSD BR Put Brazilian Fund Shares on the XRP Ledger
Ripple announced on September 29 that Brazil’s CSD BR, a securities depository with more than BRL 22 trillion in registered assets, will mirror ownership records for BTG Pactual investment fund shares on the XRP Ledger using its Multi-Purpose Token standard. The key terms from Ripple’s release:
- CSD BR’s own systems stay the official record, with the ledger serving as a second layer for querying and auditing.
- The setup is permissioned, limited to Brazilian corporate and banking clients that pass KYC and anti-money laundering checks, and CSD BR can freeze assets or reverse transactions on regulatory or court order.
- Later phases could add native issuance and trading among authorized participants, with real estate and agribusiness receivables certificates under consideration.
The release is Ripple’s own document, and it describes use of the ledger rather than any demand for the XRP token. It also gives no timeline for the later phases.
XRP News: Bitwise’s Hougan Says Advisers Are Driving XRP ETF Demand
Token Relations reported that XRP ETF net assets have grown 80% through the third quarter to a record $1.77 billion.
Bitwise Chief Investment Officer Matt Hougan credited financial advisers, who he said are confident XRP will last given its “enormous track record” and who understand its stablecoin and cross-currency payment uses. Bitwise issues an XRP ETF, so this is an interested party’s view.
XRP ETF Flows: An 11th Straight Weekly Inflow
XRP spot ETFs took in $75.59 million in the week ending September 25, the largest weekly inflow since $110.49 million in the week ending August 28. The streak began after a $7.18 million outflow on July 10 and has brought in about $306.41 million since.
| ETF Metric | Value |
| Weekly net inflow, week ending Sep 25 | +$75.59M |
| Weekly net inflow, week ending Sep 18 | +$9.56M |
| Consecutive weeks of inflows | 11 |
| Cumulative net inflow | $1.79B |
| Total net assets | $1.77B |
XRP Price Prediction for October 2026: Week-by-Week Outlook
| Period | Expected Range | Key Levels |
| Oct 1 to 7 | $1.44 to $1.56 | The 20-day EMA at $1.46 and SAR at $1.45 need to hold, with $1.51 as the first hurdle. |
| Oct 8 to 14 | $1.42 to $1.62 | The rising lower line closes in on price, so a close above $1.51 keeps XRP inside the triangle’s upper half. |
| Oct 15 to 21 | $1.37 to $1.70 | A close above $1.64 opens $1.70, while losing the lower line exposes $1.37. |
| Oct 22 to 31 | $1.31 to $1.70 | The triangle’s apex near $1.60 forces a break, with $1.70 as resistance and $1.31 as support. |
XRP Price Prediction: Bullish and Bearish Scenarios for October
Bullish Case, Target: $1.70
XRP holds the 20-day EMA at $1.46, clears $1.51, then closes a day above the triangle’s upper line near $1.64. That puts the $1.65 September high and the $1.70 August high in range, with the ETF inflow streak as support.
Bearish Case, Risk Level: $1.31 (100-Day EMA)
XRP loses $1.46 and then $1.37, where the lower trendline and the 50-day and 200-day EMAs meet. A daily close below that zone would expose the 100-day EMA at $1.31, a path October’s record of eight down years in 13 makes plausible.
XRP Price Prediction FAQs
XRP could extend toward $1.65 and then $1.70 in October if it holds above $1.37 and closes above the triangle’s upper line near $1.64. A daily close below $1.37 would put the 100-day EMA at $1.31 in play.
It is unlikely on the historical record. $2 would need a gain of about 34% from $1.49, roughly double the best October in the table, 16.9% in 2021. $1.70 is the more realistic stretch at about 14%, a gain that three of the 13 Octobers since 2013 matched or beat.
Yes, if it loses the triangle’s lower line and the $1.37 support. That is a drop of about 13%, and four of the 13 Octobers since 2013 fell by more, in 2024, 2018, 2015 and 2013. The 100-day EMA at $1.31 sits just above that level.
XRP closed October lower in eight of 13 years from 2013 through 2025, with an average loss of 5.14% and a median loss of 2.97%. The last two Octobers fell 11.9% in 2025 and 16.7% in 2024.
Yes. XRP spot ETFs have posted net inflows for 11 straight weeks, including $75.59 million in the week ending September 25, according to SoSoValue. Cumulative net inflows stand at $1.79 billion, and net assets are at an all-time high of $1.77 billion, per Token Relations.
Disclaimer: The information presented in this article is for informational and educational purposes only. The article does not constitute financial advice or advice of any kind. Coin Edition is not responsible for any losses incurred as a result of the utilization of content, products, or services mentioned. Readers are advised to exercise caution before taking any action related to the company.