


- FET and RNDR prices increase by 45.57% and 21.44% respectively.
- If FET crosses the $1 overhead resistance, the price could climb to $3 in the mid-term.
- A buy signal appears for RNDR at $5.51, as well as a possible extension to $9.
AI-themed cryptocurrencies registered incredible performances in the last few days, according to data from CoinMarketCap. But out of the many tokens in this category, Fetch.ai (FET) and Render (RNDR) are leading the charge for dominance as the full-blown bull market approaches.
Within the last seven days, FET’s price rose from $0.67; at press time, it changed hands at $0.97. This represented a 47.57% increase. RNDR’s price jumped by 21.44% within the same period.
However, Coin Edition found that the hike was propelled by the launch of Sora. Sora is a text-to-video tool recently released by OpenAI. With increasing hype around AI, traders flocked to the market to keep the buying pressure on.
But that’s not all. We also discovered that more AI-related events are coming up later in the year. As such, this could fuel price rallies for AI tokens like FET and RNDR.
FET Price Analysis
On the 4-hour timeframe, FET’s price had attempted to surge past the $1 mark. But bulls could not prevail as the price fell back to $0.95. From the technical outlook, there was strong support at $0.82.
If bulls can defend this support, then, FET’s price might beat the overhead resistance at $1 and surge higher. However, failure to defend this region could send the price plunging as low as $0.70 in the short term.
But the long-term view for FET as displayed by the Exponential Moving Average (EMA) looked bullish. As of this writing, the 50 EMA (blue) had crossed over the 200 EMA (yellow), reinforcing the bullish thesis.
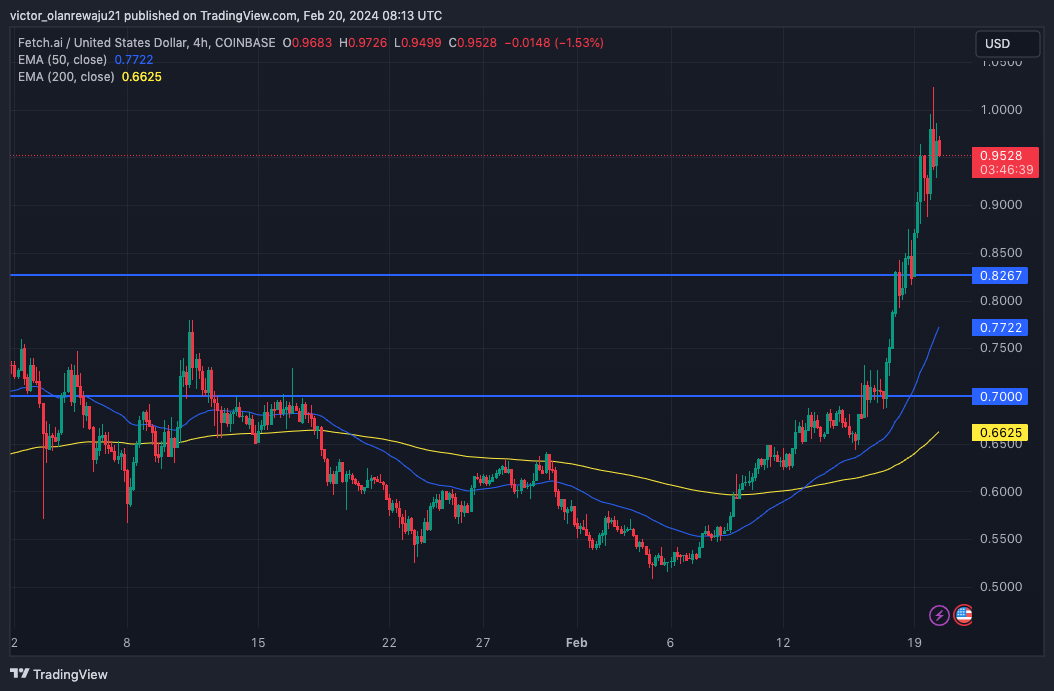
If FET falls below $0.65, then the thesis could be invalidated. But if the token swings above $0.70 irrespective of potential profit-taking, then the price might trend higher. In a highly bullish case, FET’s price might jump 3x from $0.95. But if bears’ dominance appears, the value could fall to $0.70.
RNDR Price Analysis
The RNDR/USD 4-Hour structure was similar to FET. On February 19, RNDR’s price had attempted to hit $6.40. But it was pegged back by the resistance at $6.31. However, indications from the Supertrend showed that the token might still offer a buying opportunity.
At press time, the Supertrend indicated that a good entry for RNDR in the long term could be around $5.51. Therefore, if RNDR’s price pulls back and hits the zone, traders could set buy orders at $5.51.
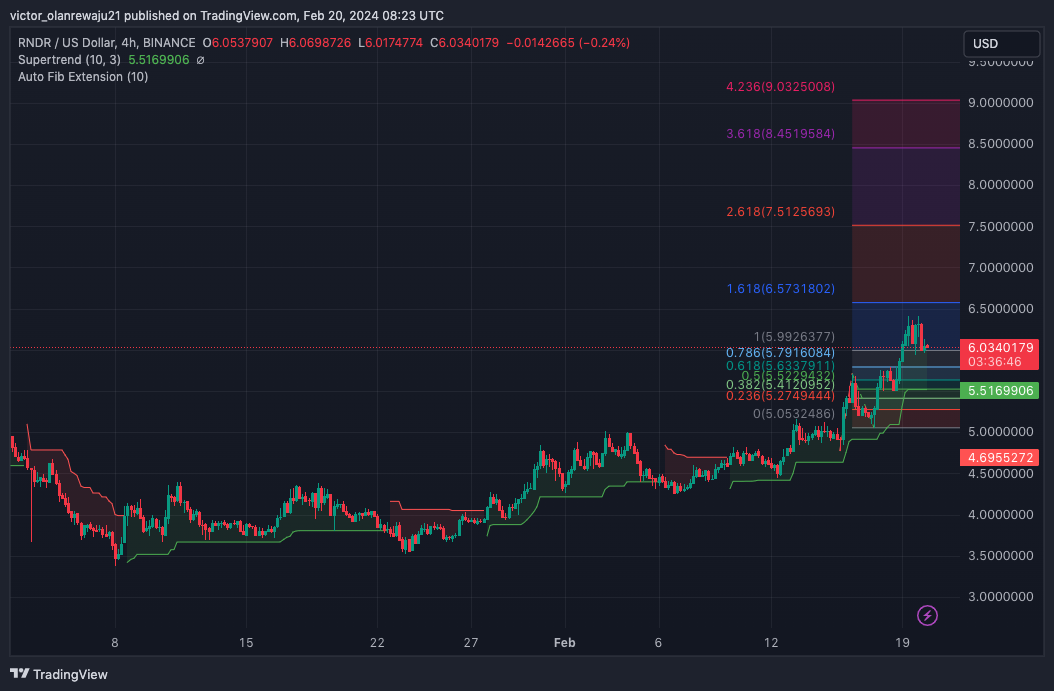
Interestingly, the 0.236 Fibonacci level was positioned at $5.51, confirming the Supertrend buy signal. On the other end of Fibonacci was the 4.236 level which was at $9. Should buying pressure return, RNDR’s price could extend to $9 in the mid-term.
Disclaimer: The information presented in this article is for informational and educational purposes only. The article does not constitute financial advice or advice of any kind. Coin Edition is not responsible for any losses incurred as a result of the utilization of content, products, or services mentioned. Readers are advised to exercise caution before taking any action related to the company.


