

- Bitcoin must first reclaim $68,500, then $75,800, to confirm a genuine reversal.
- The Realized Profit/Loss Ratio is at 0.75, above the seller exhaustion zone.
- US spot demand remains weak, with the Coinbase Premium still negative.
Bitcoin has bounced off recent lows, but according to data from Glassnode, the signals separating a genuine trend reversal from a temporary bull trap haven’t lined up yet.
Dollar weakness would normally support Bitcoin. Instead, US 10-year Treasury yields have kept climbing toward 4.7%, and Bitcoin has failed to respond meaningfully, remaining anchored near cycle lows around $60,000 to $65,000.
Elevated real yields appear to be the dominant constraint right now, raising the opportunity cost of holding an asset that pays no yield. At the same time, gold sits near $4,400, and oil has recovered into the mid-$80s, while Bitcoin remains well off its highs. That gap suggests Bitcoin is still trading like a liquidity-sensitive risk asset rather than an inflation hedge
Two Levels Traders Need to Watch
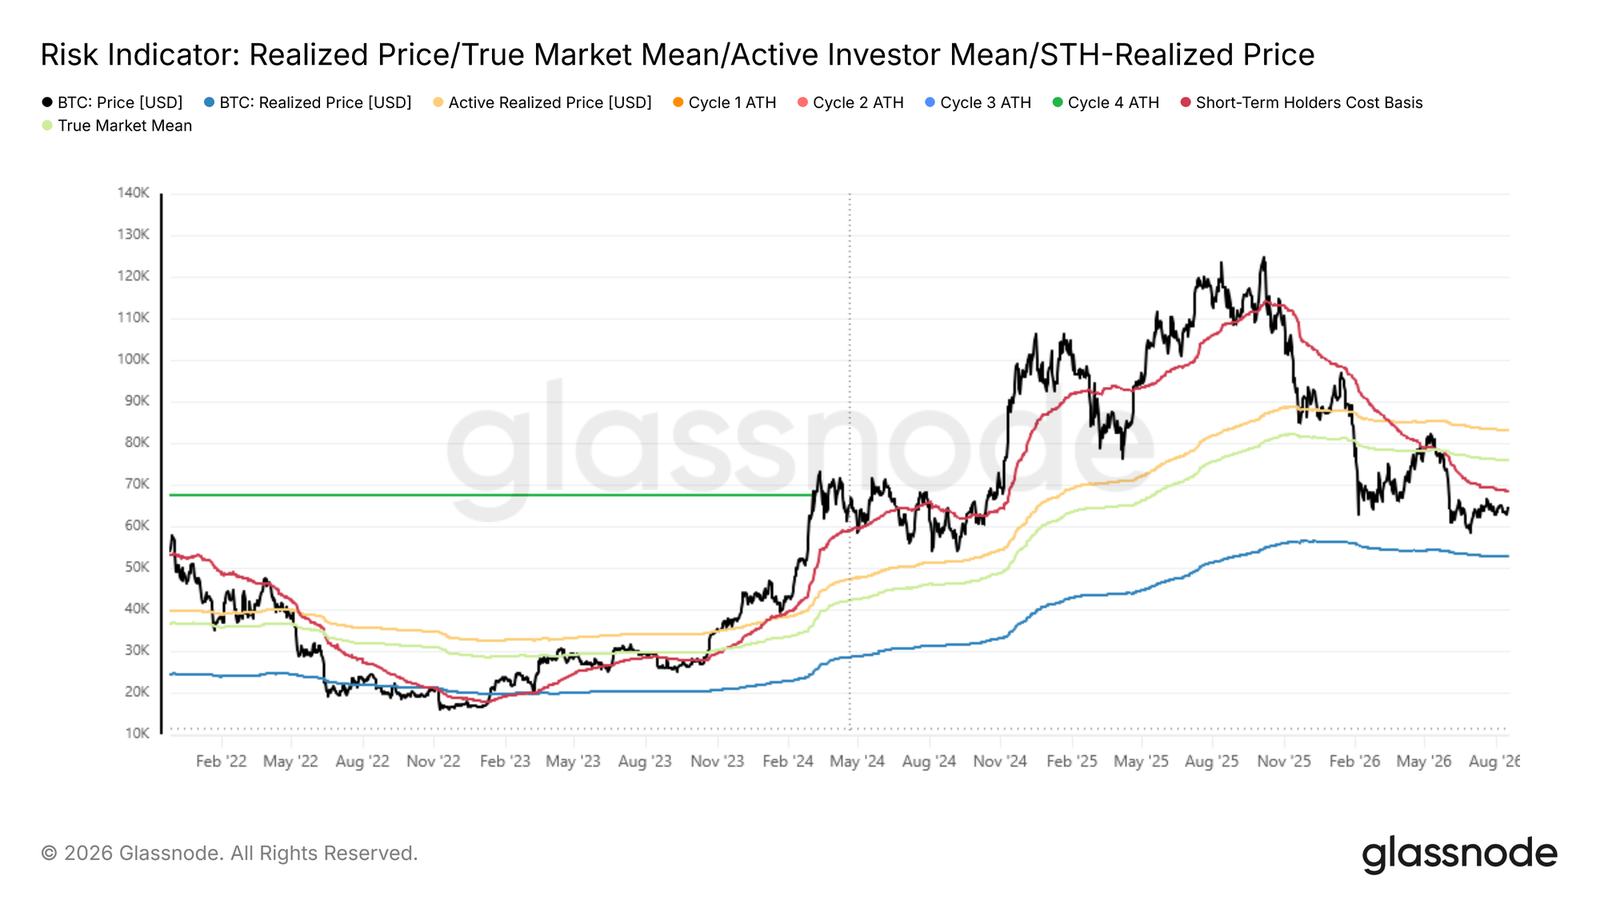
On-chain data points to a two-step test for confirming a real recovery. Bitcoin must first reclaim $68,500, then $75,800, to confirm a genuine reversal.
- $68,500 is the Short-Term Holder Cost Basis, the average price recent buyers paid for their coins
- $75,800 is the True Market Mean, what the entire active investor base paid on average
- Bitcoin has traded beneath both levels since early February 2026, a setup Glassnode calls a capitulation phase, the same configuration that has historically preceded past cycle bottoms
This Capitulation Has Been Shallower
Despite trading in capitulation territory for close to three months, investor pain has stayed relatively muted.
- Relative Unrealized Loss peaked near 25% this cycle, well below the readings above 60% seen in past capitulation phases
- That partly reflects a shallower drawdown overall
- It also reflects how coins accumulated around the election period at prices well below the all-time high, spreading out overhead supply rather than concentrating it near the peak
Number That Signals True Exhaustion
One metric stands out as the clearest gauge of whether sellers have truly run out of pressure. The Realized Profit/Loss Ratio is at 0.75, above the seller exhaustion zone, a threshold that has historically needed to fall below 0.5 before past cycles found their actual bottom. Until that happens, Glassnode suggests treating any recovery as a local rally rather than a full regime change.
Leverage Traders Are Warming Up, Spot Buyers Aren’t
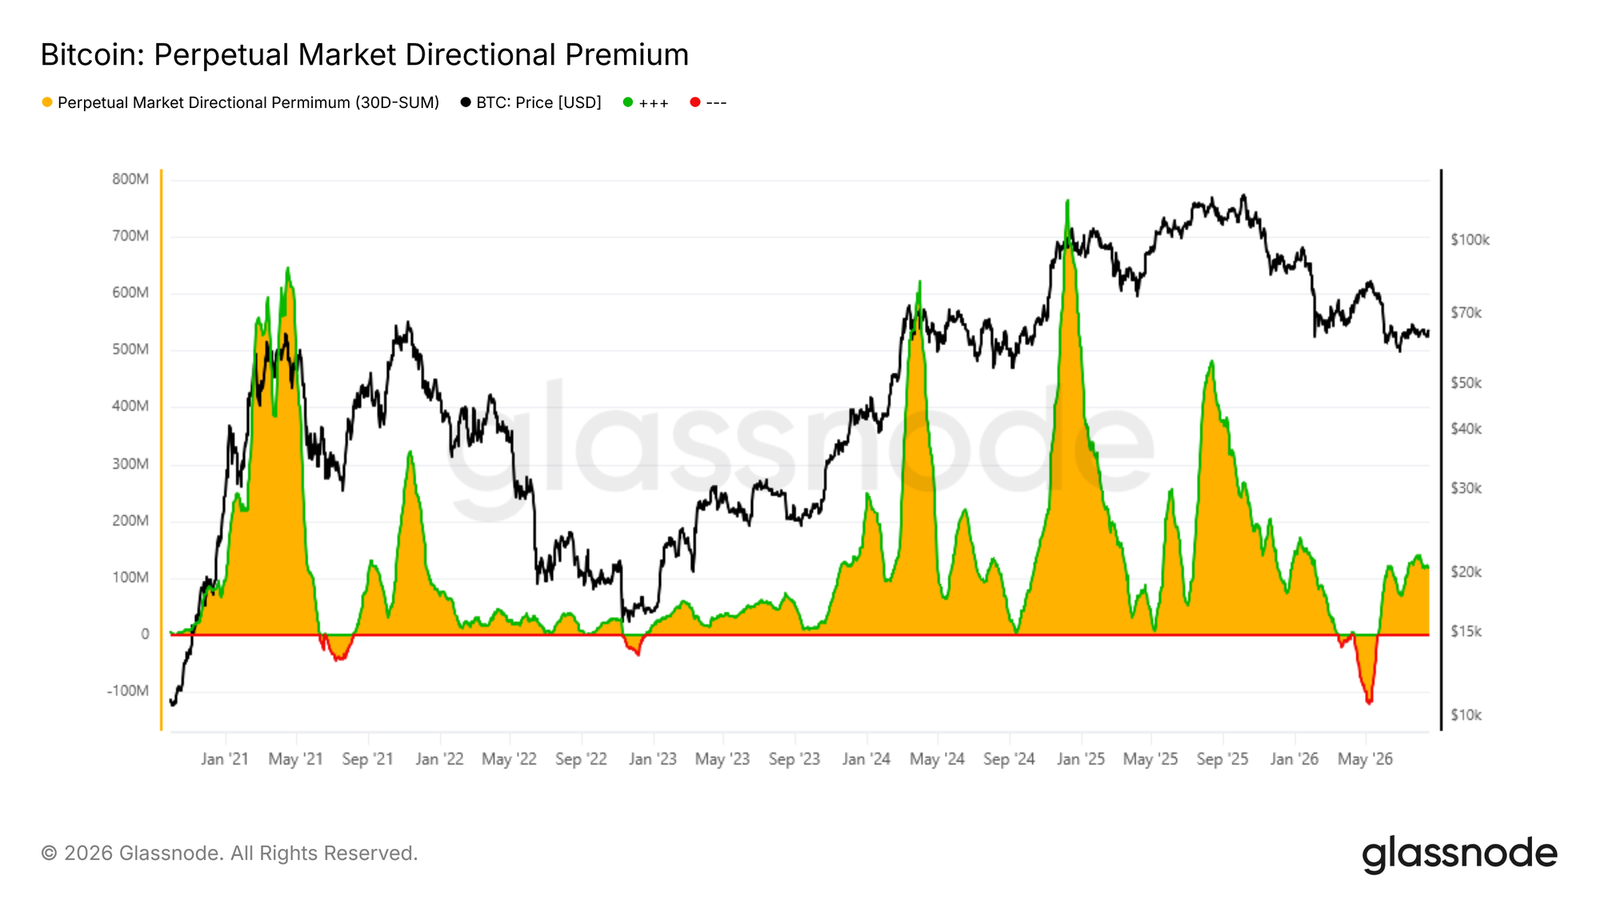
Derivatives positioning has turned more constructive, but spot demand tells a different story.
- The 30-day Perpetual Market Directional Premium has swung back into positive territory, meaning leveraged traders are once again paying up for long exposure
- Current levels remain modest compared to past bull runs
- US spot demand remains weak, with the Coinbase Premium still negative right now, signaling American buyers haven’t meaningfully re-engaged
- That gap between improving leverage appetite and absent spot buying is exactly the kind of divergence that can produce a bull trap rather than a durable recovery
ETF Flows Are Stabilizing, But Not Surging
Institutional selling pressure has eased noticeably.
- US spot ETF outflows fell as low as 5,000 BTC daily before recently stabilizing
- Flows have repeatedly turned positive since, including a strong accumulation burst in early August
- Still, the pattern hasn’t turned into sustained, persistent buying, leaving the case for a rebuilding institutional bid incomplete for now
Options Markets Show a Market Still Undecided
- Implied volatility has compressed toward the mid-30s, near the lower end of its two-year range
- Downside protection costs have eased at the very short end of the curve, even as investors further out continue paying a premium for puts
- Options positioning around the $65,000 strike shows active two-way trading rather than a clear directional bet
- Selective call buying appears near $68,000 and $130,000, alongside continued deep downside hedging near $45,000
Taken together, the picture is one of a market still working out which way this move ultimately breaks.
Related: What Happens If You Buy Bitcoin Before the Bottom Is Confirmed?
Disclaimer: The information presented in this article is for informational and educational purposes only. The article does not constitute financial advice or advice of any kind. Coin Edition is not responsible for any losses incurred as a result of the utilization of content, products, or services mentioned. Readers are advised to exercise caution before taking any action related to the company.