


- GAL might retest $2.65 while ZETA’s capital inflow dropped, suggesting a decrease to $1.47.
- PYTH might extend to $0.70 if buying pressure returns.
- BEAM’s fall to $0.020 looked imminent as bearish momentum appeared.
Altcoin prices, including Galxe (GAL), Zeta Chain (ZETA), Pyth Network (PYTH), and Beam (BEAM) have made notable gains in the last seven days. According to CoinMarketCap, GAL’s price increased by 18.29% within the said period.
The value of ZETA jumped by 12.55% while PYTH climbed by 14.39%. BEAM had the most significant increase as the price rose by 50.65%, making these projects some of the best-performing ones over the last week.
Galxe (GAL)
GAL’s rise began around February 3. Around that time, the price was $1.77. Details from the 4-hour GAL/USD chart showed that bulls propelled the price to $2.15 by February 7. But between February 7 and 8, the price traded sideways, indicating that some participants booked profits while others were buying.
At press time, the Relative Strength Index (RSI) was 67.54, suggesting that buyers were very much present. Should the buying momentum continue, GAL’s price might jump to $2.65. However, that would need an engulfing candlestick to appear after the recent red bar at $2.26.
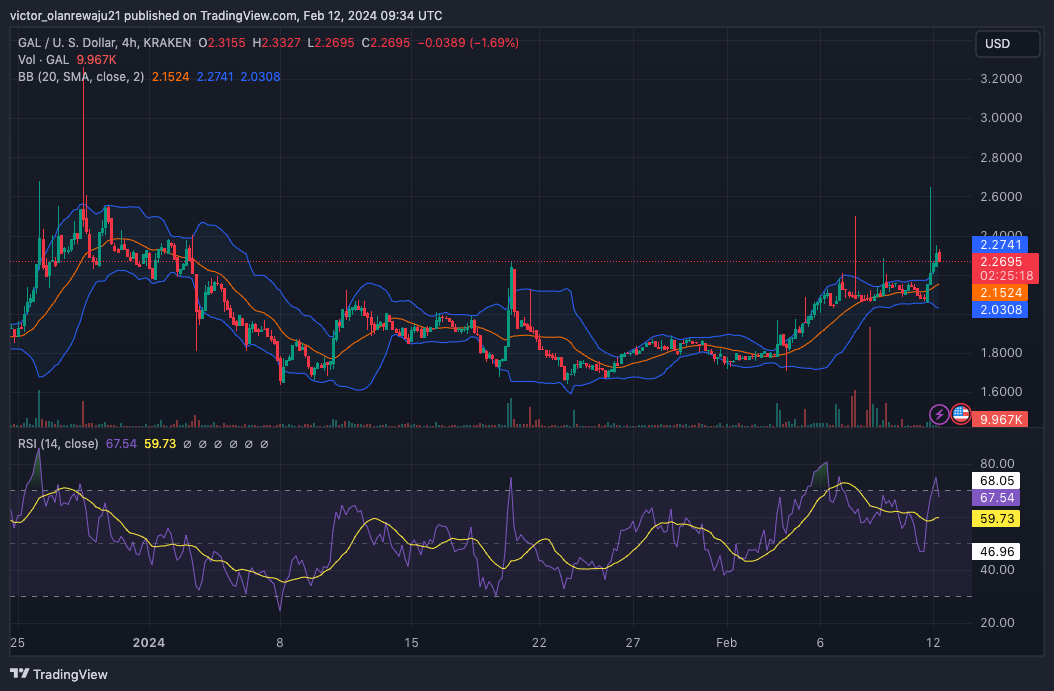
However, the Bollinger Bands (BB) showed that GAL’s volatility was not extremely high. This suggests that price fluctuations might not be massive. In a highly bullish situation, GAL might not rise higher than $2.65. But if the structure becomes bearish, the token could fall below $2.
Zeta Chain (ZETA)
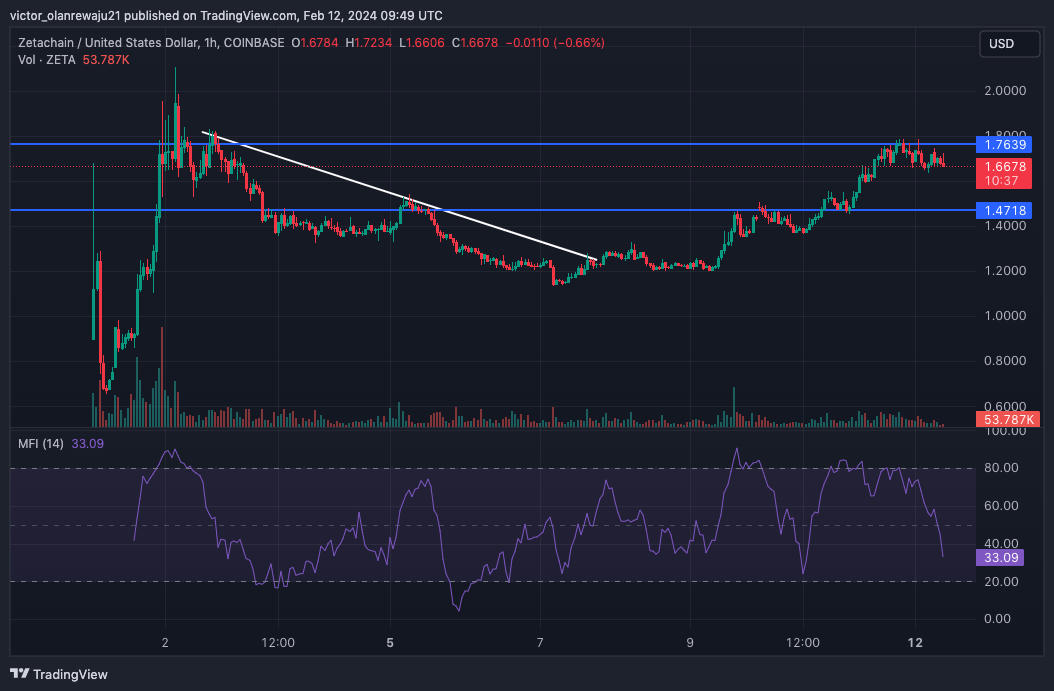
ZETA’s market structure mirrored a token that still seemed to be in price discovery. In the 1-hour timeframe, ZETA’s price dropped from $1.79 on February 2 to $1.24 a few days after. However, interest in the cryptocurrency grew after that, and the cryptocurrency was able to retest $1.79.
However, the recent price fall showed that there was resistance around $1.76. A close above the resistance could send ZETA to the $2 region. But if the price gets rejected again, ZETA might drop to $1.47, where major support lies.
When Coin Edition looked at the Money Flow Index (MFI), we discovered that the reading had dropped. The decreasing MFI reading suggests a drop in capital inflow. Should this remain the same, ZETA’s structure might tilt to the bearish side while the price nosedives.
Pyth Network (PYTH)
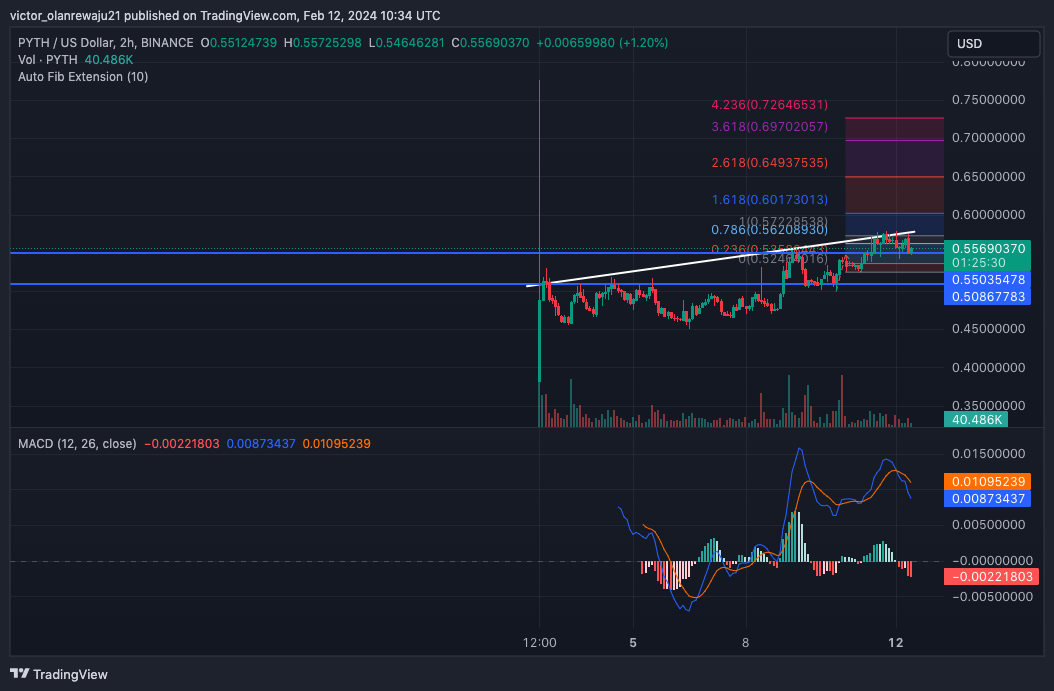
The PYTH/USD 2-hour chart showed a token looking to rise but has been stopped at different times. First, PYTH climbed to $0.55 on February 24. However, it did not take long for the price to fall to $0.50, which later turned into support.
PYTH then rose to $0.56 on February 12, but it was quickly rejected and was trading at $0.55 at press time. From the chart below, the $0.55 region seemed to have turned into support for the token.
Therefore, if buying pressure increases, PYTH’s price might rise above $0.57. However, the Moving Average Convergence Divergence (MACD) suggested that the momentum might have turned bearish.
As it stands, PYTH might drop to $0.53. But in the short to mid-term, PYTH’s price could extend to $0.70, where the 3.618 Fibonacci extension was.
Beam (BEAM)
BEAM’s price at press time was $0.025 after it faced a hurdle at $0.026. Previously, the Awesome Oscillator (AO) indicated increasing upward momentum for the token due to high green bars.
However, press time data from the 4-hour chart showed that the histogram bars were now in red. This suggests bearish momentum for BEAM. Should bulls fail to keep up the buying momentum, then BEAM’s price might fall by $0.020.
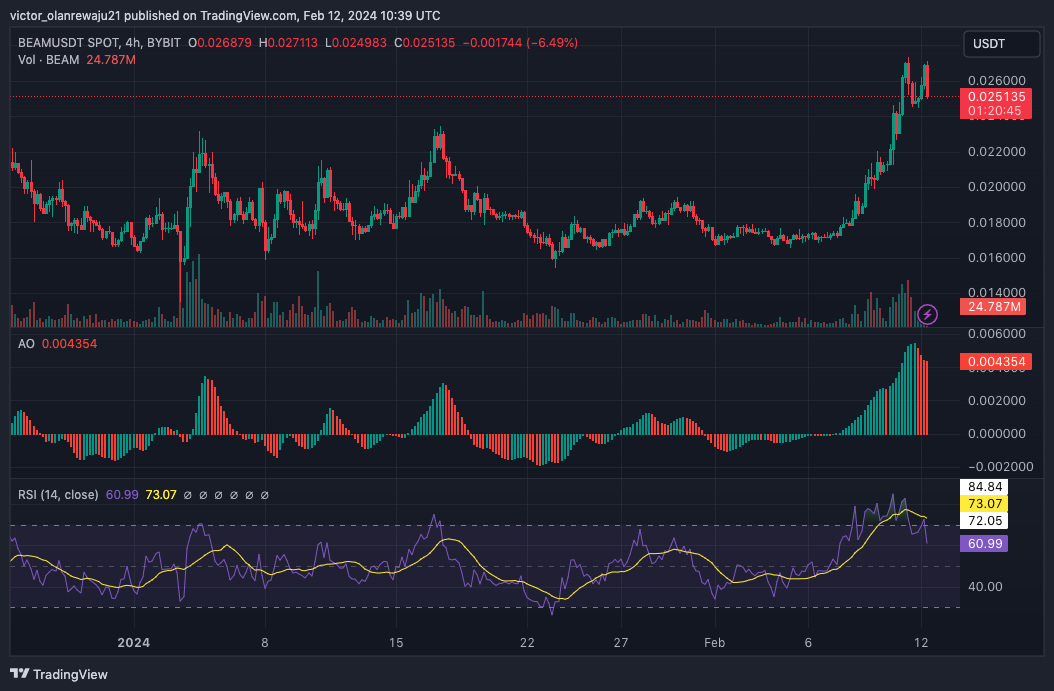
This was also supported by the Relative Strength Index (RSI). At press time, the RSI had dropped from its previous high of 73.08, suggesting that BEAM was overbought. If the RSI reading continues to drop, then BEAM’s price might follow.
Disclaimer: The information presented in this article is for informational and educational purposes only. The article does not constitute financial advice or advice of any kind. Coin Edition is not responsible for any losses incurred as a result of the utilization of content, products, or services mentioned. Readers are advised to exercise caution before taking any action related to the company.

: What Happens If You Use an Unlicensed Platform?")


