

- Hyperliquid converted $1.26 trillion in volume into $275.8 million in passive revenue.
- June led the period with $81.6 million in fees and $57.9 million in passive revenue.
- Gross fee take fell 15.8% from February to July as monetization efficiency weakened.
Hyperliquid processed about $1.26 trillion in trading volume from February through July 27, converting that activity into $381.5 million in gross fees. During the same period, the on-chain exchange generated $307.1 million in gross profit and $275.8 million in passive revenue, according to Artemis data.
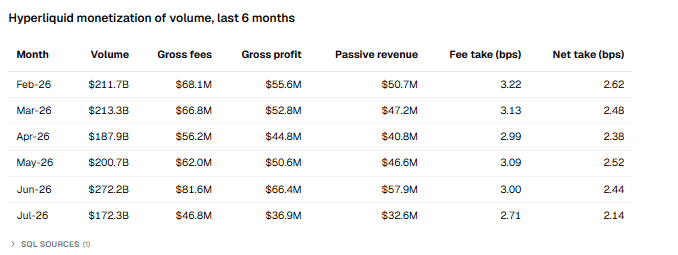
Together, those figures illustrate how trading activity translated into protocol value, even as the amount collected from each dollar of volume gradually declined. Hyperliquid maintained an 80.5% gross-profit margin on fees, while passive revenue accounted for almost 90% of gross profit.
June Leads Hyperliquid’s Six-Month Revenue Performance
According to the data, June delivered the strongest monthly performance, with $272.2 billion in volume, $81.6 million in gross fees, and $66.4 million in gross profit. In addition, passive revenue reached $57.9 million, making June the leading month across all four reported measures.
More broadly, Hyperliquid handled approximately $1.09 trillion in volume during the five complete months through June. That activity generated $334.7 million in gross fees, $270.2 million in gross profit, and $243.2 million in passive revenue.
February, meanwhile, established the period’s strongest monetization rates. The exchange processed $211.7 billion in volume and collected $68.1 million in gross fees.
That performance produced a 3.22-basis-point fee take, equivalent to about $322,000 for every $1 billion traded. Gross profit reached $55.6 million, resulting in a 2.62-basis-point net take, or roughly $262,000 per $1 billion.
Fee Take Rates Fall Despite Expanding Trading Volume
May briefly reversed the trend, as gross fees increased to $62 million and fee take recovered to 3.09 basis points. However, June’s record volume did not restore February’s efficiency. Its gross fee take stood at 3 basis points, while its net take reached 2.44 basis points.
Notably, July data covered activity only through July 27, making full-month comparisons less reliable than take-rate comparisons. Even so, the partial month showed $172.3 billion in volume, $46.8 million in gross fees, and $36.9 million in gross profit.
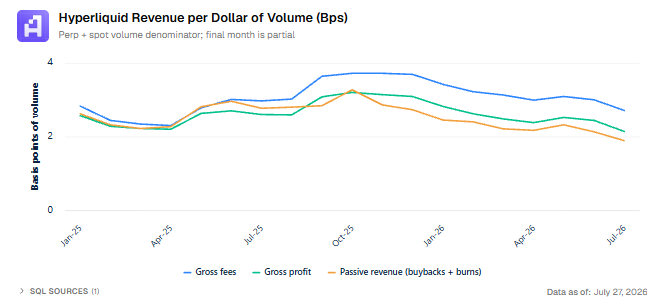
At the same time, passive revenue reached $32.6 million, while gross fee take fell to 2.71 basis points. Net take also declined to 2.14 basis points, and passive revenue represented 1.89 basis points of volume.
Overall, between February and July, gross fee take decreased 15.8%, while net take fell 18.3%. Even excluding incomplete July, both measures declined approximately 6.8% between February and June.
Across the dataset, the volume-weighted fee take averaged about 3.03 basis points. Meanwhile, gross profit averaged 2.44 basis points, equivalent to approximately $244,000 per $1 billion traded.
Lower Fee Efficiency Raises Reliance on Trading Activity
The declining take rate indicates that Hyperliquid collected less fee value from each dollar traded as the period progressed. This trend partly reflects its rolling 14-day volume tiers, which reduce perpetual taker rates for larger users from a starting rate of 0.045%.
Staking can reduce fees by as much as 40%, while maker rebates can further lower effective charges. Moreover, HIP-3 growth mode cuts relevant protocol fees by 90%, reducing the blended fee take across eligible markets.
Despite that compression, gross profit consistently represented approximately 79% to 82% of gross fees throughout the period. This stability indicates that lower monetization per unit of volume created the pressure, rather than weaker conversion of fees into gross profit.
Essentially, Hyperliquid distributes fees among HLP, the assistance fund, and market deployers. The assistance fund then converts trading fees into HYPE before permanently removing the tokens through burns.
Meanwhile, the protocol’s order books operate within HyperCore, where orders, trades, and liquidations settle onchain. This structure keeps core market activity and fee distribution within the network’s infrastructure.
Because the fees do not accrue to a company, passive revenue represents protocol or token value accrual rather than conventional corporate sales. Overall, the dataset shows substantial value generation from trading activity, although lower take rates increase reliance on sustained volume.
Related: Hyperliquid’s HIP-3 Markets Set New Record, Boost HYPE’s Bullish Sentiment
Disclaimer: The information presented in this article is for informational and educational purposes only. The article does not constitute financial advice or advice of any kind. Coin Edition is not responsible for any losses incurred as a result of the utilization of content, products, or services mentioned. Readers are advised to exercise caution before taking any action related to the company.